Server Dashboard
Activity
Live Query Statistics
Profiler
Server Memory
Waits
Error Log
Cpu
IO
SQL Queries
Healthcheck
Databases
Database
Tables/Partitions
Index Use
Index Fragmentation
Files
Locks
Memory
SQL Queries
Default Trace
Transaction Log
Healthcheck
Execution Plan View
Index Maintenance
Manual Index Analysis
Index Defragmentation Jobs
Alerts
Configuration
Slack Integration
Teams Integration
Custom SQL Alerts
Maintenance Windows
SQL Server Alerts List
-
After installing miniDBA run the application from the Windows Start menu. If it is the first time running you will be prompted to enter Sql Server instance details to connect to.
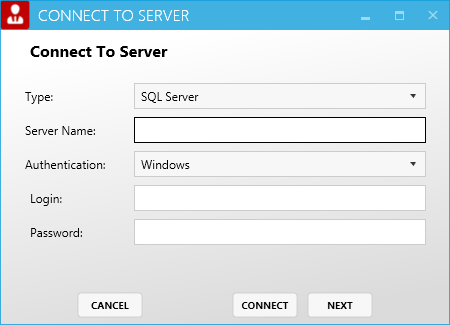
- Ensure Type: Sql Server
- Server Name: If you are connecting to a named instance then include that here
- Authentication: If your current Windows user security gives you enough permission on the Sql Server being connected to then leave authentication as windows. If you need to use Sql Server authentication including name and password then choose that here. Note: passwords are encrypted by miniDBA using built in Windows encryption functions to ensure no sensitive data is held unencrypted by miniDBA.
- Click Finish
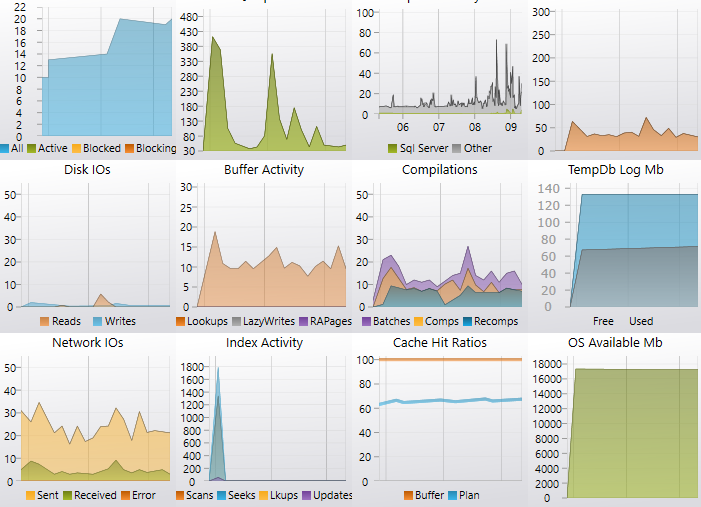
- You will now be connected to the specified Sql Server instance, its server explorer visible in the left pane of miniDBA and its server level dashboard in the right.
- The status bar at the bottom of the screen indicates what permissions you have on the server and that miniDBA is currently sampling the server every 5 seconds.
- If at any time you would like to change how often the server is sampled right click its node in the left hand server explorer, select settings then alter the sample rate.
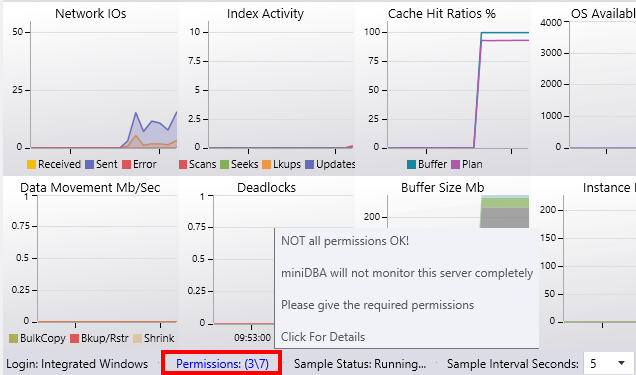
- The permission status link (in red in the above screenshot) tells you how many of the required sql server permissions the current account has.
- Click the link to see the permissions screen (below).
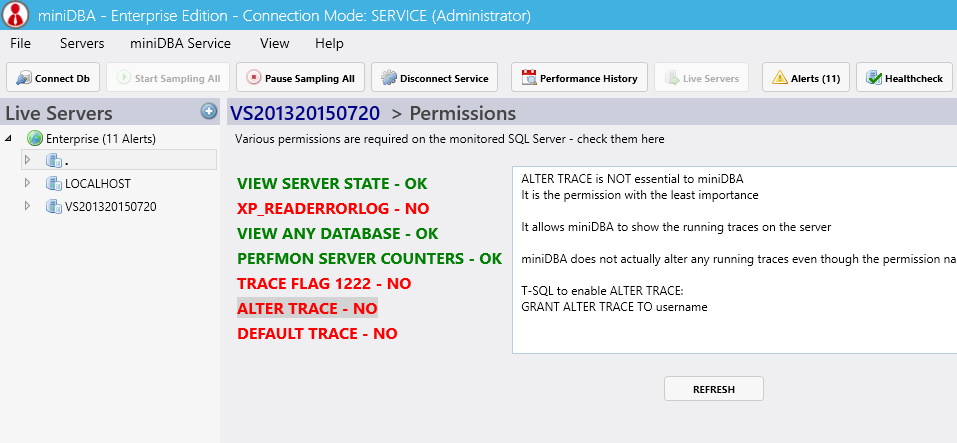
- The tabs on the left are green if the permission has been granted and red if not. A description of the permission and the T-SQL required to grant it is on the right.
- The more permissions that are given the more miniDBA can do for you. The only permission that 100% must be given is VIEW SERVER STATE.
If you have multiple server to monitor click the plus button above the server explorer window to add more servers
miniDBA will log all server activity every 60 seconds so after this point you can click the "History" button in the bottom left corner of the application and star viewing historic data.
To learn more about analysing historic data view the documentation
You may also be interested in the following topics to get you underway:
- Server Healthcheck
- Database Healthcheck
- Performance Tune SQL Servers