Server Dashboard
Activity
Live Query Statistics
Profiler
Server Memory
Waits
Error Log
Cpu
IO
SQL Queries
Healthcheck
Databases
Database
Tables/Partitions
Index Use
Index Fragmentation
Files
Locks
Memory
SQL Queries
Default Trace
Transaction Log
Healthcheck
Execution Plan View
Index Maintenance
Manual Index Analysis
Index Defragmentation Jobs
Alerts
Configuration
Slack Integration
Teams Integration
Custom SQL Alerts
Maintenance Windows
SQL Server Alerts List
Execution statistics on all queries, procedures, functions & triggers stored in the SQL server plan cache is displayed here.
There is a version of this screen at server level and also one at database level to aid database specific query tuning.
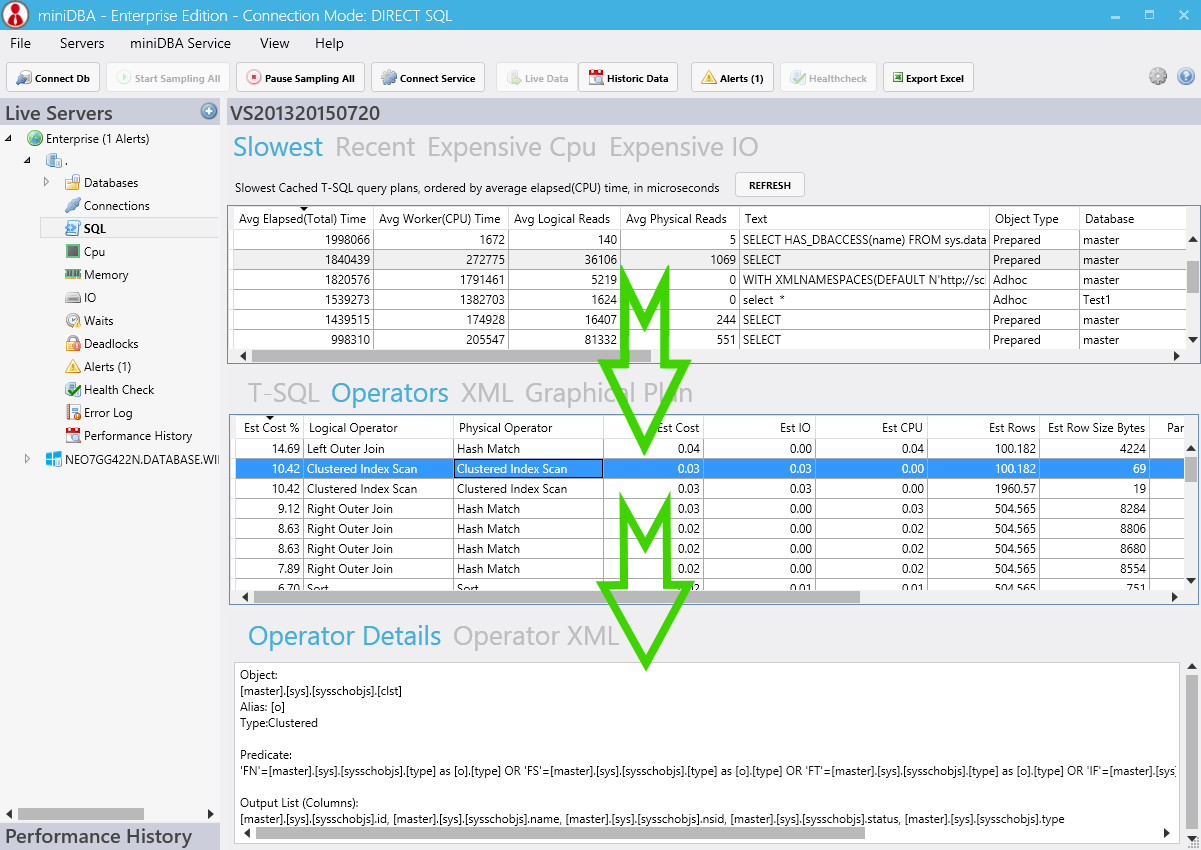
The screen works in a top to bottom workflow of 3 sections.
Clicking a row in a data table populates details in the next table shown by the green arrows in the following screenshot:
Starting the process at the top of the screen you can choose any of the 4 custom view tabs:
- Exe Count (Number of times the statement has been executed)
- Avg Worker Time (Average time the statement takes to execute)
- Avg Cpu Time (Average amount of time the statement uses the CPU)
- Avg Logical Reads (Average time the statement spends reading data)
- Avg Physical Reads (Average time the statement reads from storage)
- Total Worker Time (Time taken for all executions of the statement to execute)
- Total Physical Reads (Time taken for all executions of the statement to read from storage)
- Total Logical Reads (Time taken for all executions of the statement to read data)
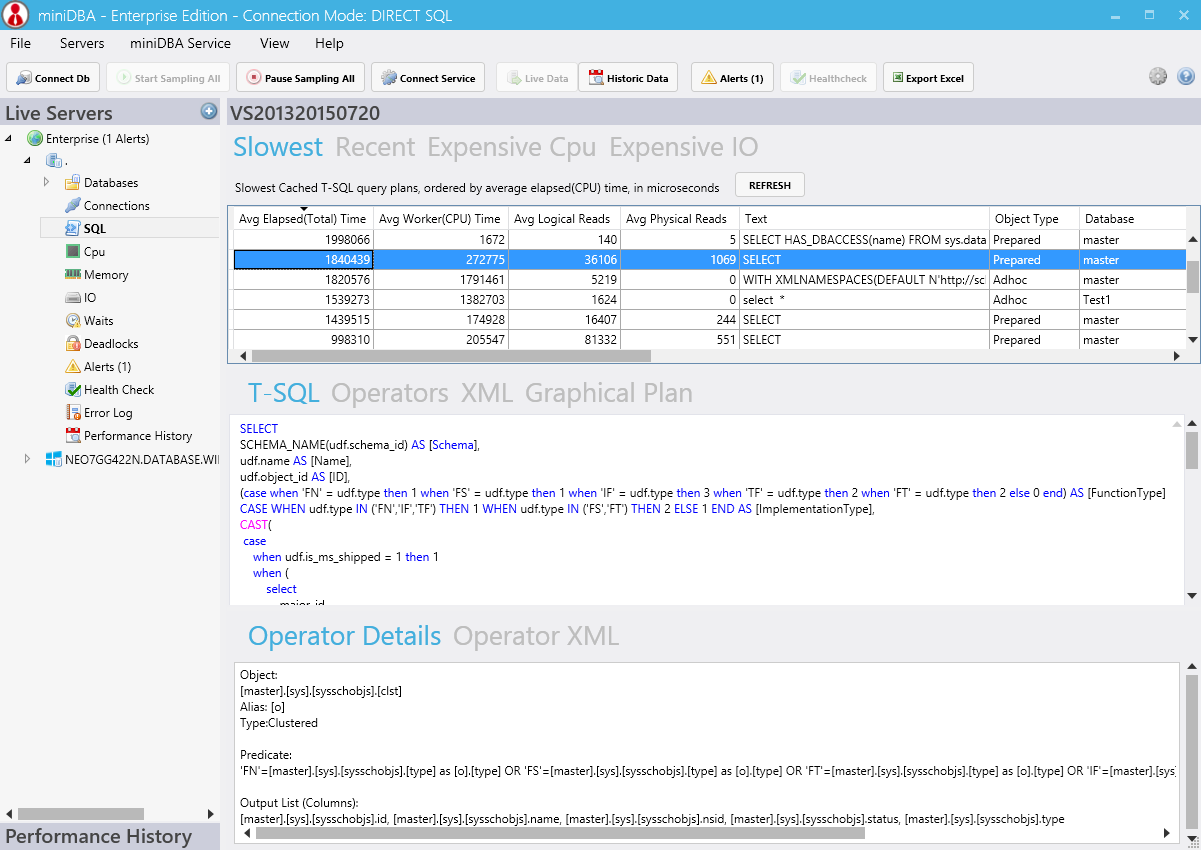
To ensure you know exactly which T-SQL statement the execution plan represents the full statement is displayed in the T-SQL window, as shown in the following screenshot:

Also found in the middle pane is the XML tab, which displays the execution plan XML and the Graphical Plan tab which automatically opens SQL Mangement Studio and loads the execution plan into the graphical display.
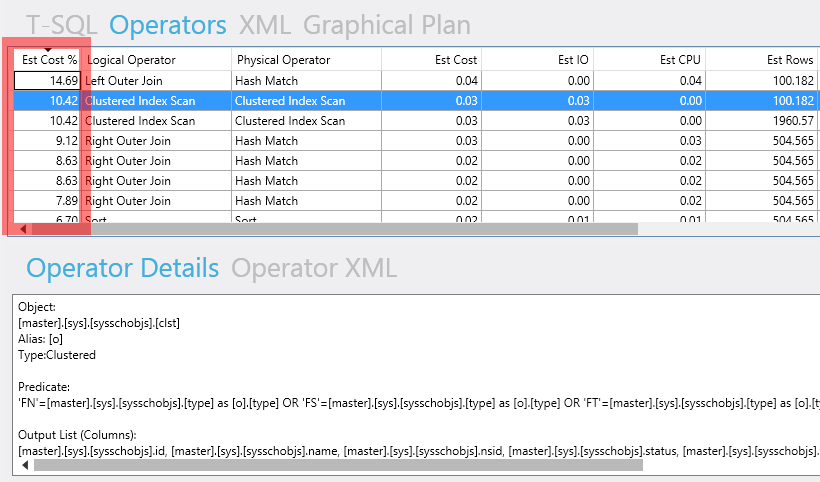
Potentially the most useful data view in this page is the ordered view of all the operators in the execution plan. The estimated cost of the operator makes it simple to drill down to the worst performing operators that need attention.
The red box indicates the sorted operator cost in the screenshot below:
Clicking on an operator will display the operator details at the bottom of the screen. This is similar information to the large tooltips in SQL management studio found on the graphical execution plans.
The operators section of the execution plan's XML can be viewed here as well by using the XML tab.
Being able to view plan operators by estimated cost as opposed to using the SQL Management Studio graphical view of cost has it's advantages. The graphical displays requires you to work your way down the execution plan tree to find poorly performing operators, frequently which are at the leaf node. Larger plans with lots of branches require a lot of time to navigate each branch looking for the root problem. This work has been erradicated by miniDBAs view of the plans meta data. The operators you are searching for are at the top of the data grid by default.
Once the problems have been found by miniDBA it is up to the user as to what to do about them. Frequently removing sorting, adding indexes and inlcuded columns can be corrective courses of action. Once these changes are made it is a simple matter of hitting the 'Refresh' button at the top of the page and see what the new estimated plans/operators look like.
There is a version of this screen at server level and also one at database level to aid database specific query tuning.
The screen works in a top to bottom workflow of 3 sections.
- The top section is a datagrid displaying cached query plans
- The middle section shows the T-SQL statement ∧ execution plan operators
- The bottom section shows details for each execution plan operator
Clicking a row in a data table populates details in the next table shown by the green arrows in the following screenshot:

Starting the process at the top of the screen you can choose any of the 4 custom view tabs:
- Slowest Queries (default) - slowest 50% of all queries
- Recent Queries - queries executed in the last 5 minutes
- Expensive CPU - queries with high processeor useage
- Expensive IO - queries with high disk useage
- Exe Count (Number of times the statement has been executed)
- Avg Worker Time (Average time the statement takes to execute)
- Avg Cpu Time (Average amount of time the statement uses the CPU)
- Avg Logical Reads (Average time the statement spends reading data)
- Avg Physical Reads (Average time the statement reads from storage)
- Total Worker Time (Time taken for all executions of the statement to execute)
- Total Physical Reads (Time taken for all executions of the statement to read from storage)
- Total Logical Reads (Time taken for all executions of the statement to read data)
To ensure you know exactly which T-SQL statement the execution plan represents the full statement is displayed in the T-SQL window, as shown in the following screenshot:

Also found in the middle pane is the XML tab, which displays the execution plan XML and the Graphical Plan tab which automatically opens SQL Mangement Studio and loads the execution plan into the graphical display.
Potentially the most useful data view in this page is the ordered view of all the operators in the execution plan. The estimated cost of the operator makes it simple to drill down to the worst performing operators that need attention.
The red box indicates the sorted operator cost in the screenshot below:

Clicking on an operator will display the operator details at the bottom of the screen. This is similar information to the large tooltips in SQL management studio found on the graphical execution plans.
The operators section of the execution plan's XML can be viewed here as well by using the XML tab.
Query Tuning
The above workflow allows for extremely efficient performance tuning of T-SQL. Locating poorly performing T-SQL, breaking it down by its operators, identifying the worst offending operators and then viewing the details of them lets you do in a couple of clicks in miniDBA what would otherwise take writing T-SQL and time.Being able to view plan operators by estimated cost as opposed to using the SQL Management Studio graphical view of cost has it's advantages. The graphical displays requires you to work your way down the execution plan tree to find poorly performing operators, frequently which are at the leaf node. Larger plans with lots of branches require a lot of time to navigate each branch looking for the root problem. This work has been erradicated by miniDBAs view of the plans meta data. The operators you are searching for are at the top of the data grid by default.
Once the problems have been found by miniDBA it is up to the user as to what to do about them. Frequently removing sorting, adding indexes and inlcuded columns can be corrective courses of action. Once these changes are made it is a simple matter of hitting the 'Refresh' button at the top of the page and see what the new estimated plans/operators look like.