Server Dashboard
Activity
Live Query Statistics
Profiler
Server Memory
Waits
Error Log
Cpu
IO
SQL Queries
Healthcheck
Databases
Database
Tables/Partitions
Index Use
Index Fragmentation
Files
Locks
Memory
SQL Queries
Default Trace
Transaction Log
Healthcheck
Execution Plan View
Index Maintenance
Manual Index Analysis
Index Defragmentation Jobs
Alerts
Configuration
Slack Integration
Teams Integration
Custom SQL Alerts
Maintenance Windows
SQL Server Alerts List
The server memory screen is broken into the performance dashboard and object usage tabs.
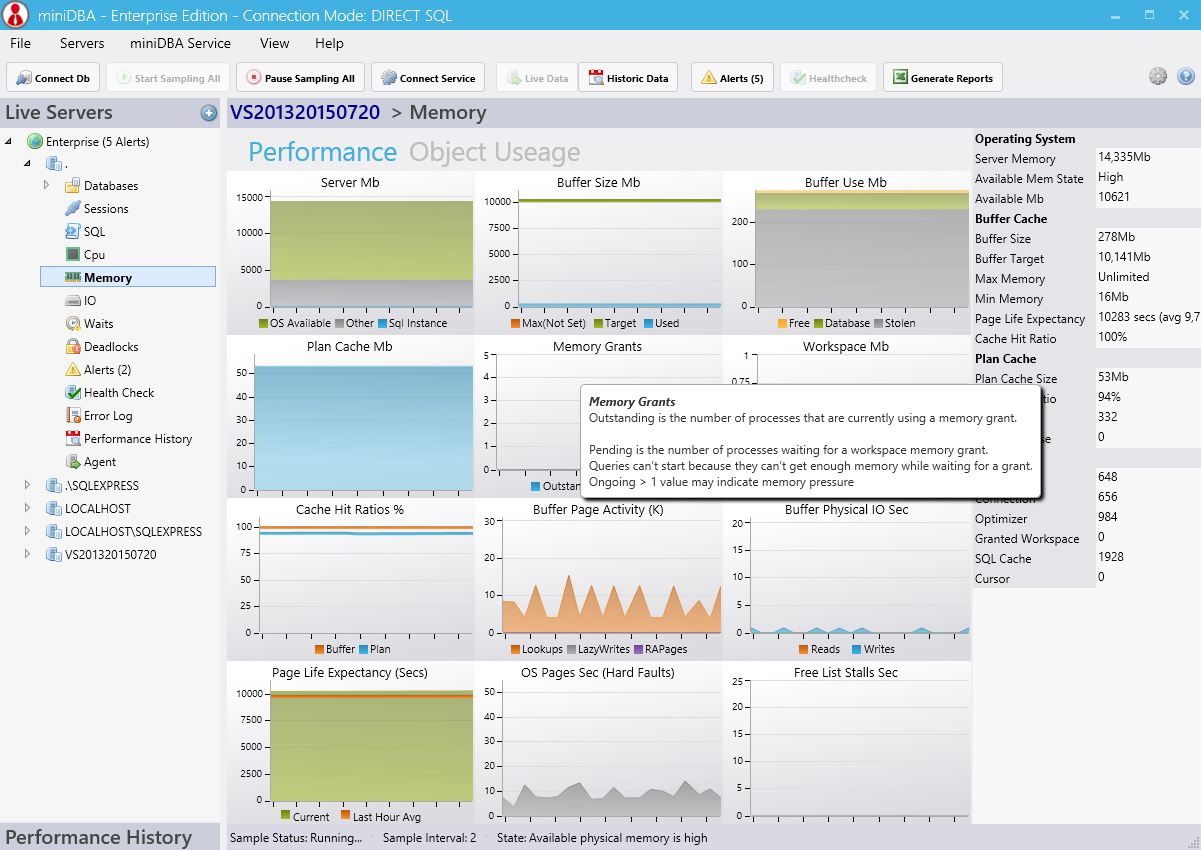
"Other" is all other programs and services running in Windows (including the OS).
"OS Available" is memory not being used by any program which the OS can allocate if it needs to.
Target is what the optimum memory SQL Server would like to have.
Used is what is actually being used by SQL Server
Database memory is being used by databases to store their data.
Stolen memory is taken from the buffer pool to use for miscellaneous server purposes (including procedure cache).
This is part of the servers stolen memory.
Pending is the number of processes waiting for a workspace memory grant.
Queries can’t start because they can’t get enough memory while waiting for a grant.
Ongoing value of more than 1 may indicate memory pressure
The maximum workspace can be up to 75% of Target Server Memory.
Granted workspace memory is currently being used in the workspace.
The memory grants graph shows processes using and waiting to use workspace memory.
Generally lower percentages may indicate a lot of (slow) physical disk reads, which extra memory may alleviate.
Plan hit ration shows % of batches that have existing plans in the cache.
The higher the better as queries with existing plans will execute faster than those without.
Lookups are logical reads of data required to satisfy the query which may spill to disk.
Lazy Writes are the number of times per second SQL Server relocates dirty pages from buffer pool (memory) to disk. If it is above 20 then memory pressure may be present.
Read Ahead Pages are physically read from the disk as an internal performance enhancement.
Because physical I/O is expensive, you may be able to minimize the cost by:
This number can be extremely high, pages may stay in the cache for days, so there is no absolute number to look for, just large relative drops.
The average over the last hour is displayed, to help identify any drops.
The average Pages/sec value should be below 50.
Memory pressure may be indicated by consistently high pages/sec.
When no free pages in the buffer cache, the request is stalled and waits until a page in the buffer is freed.
The recommended value is 2 and under.
- SQL Cache - memory the server is using for the dynamic SQL cache
- Locks - dynamic memory the server is using for locks
- Connections - dynamic memory the server is using for maintaining connections
- Optomizer - dynamic memory the server is using for query optimization
- Cursor - memory consumed by cursors
SQL Server has a hard limit on all caches and soft limit on each individual cache. The hard limit changes from version to version and also the memory available. The soft limit is limited to 62.5% of total cache size. Any cache can grow to 62.5% of the total cache limit (hard limit).
Charts
Server Mb
"SQL Instance" is total memory this instance of SQL Server is using."Other" is all other programs and services running in Windows (including the OS).
"OS Available" is memory not being used by any program which the OS can allocate if it needs to.
Buffer Size
Max displays the maximum buffer size if it has been set. If there is no max then the line is not displayed.Target is what the optimum memory SQL Server would like to have.
Used is what is actually being used by SQL Server
Buffer Contents - How the buffer cache is being used
Free memory is committed memory currently not used by the server.Database memory is being used by databases to store their data.
Stolen memory is taken from the buffer pool to use for miscellaneous server purposes (including procedure cache).
Plan Cache Size Mb
The amount of memory being used to store execution plans.This is part of the servers stolen memory.
Memory Grants
Outstanding is the number of processes that are currently using a memory grant.Pending is the number of processes waiting for a workspace memory grant.
Queries can’t start because they can’t get enough memory while waiting for a grant.
Ongoing value of more than 1 may indicate memory pressure
Workspace Mb - memory set aside for executing processes
Hash, sort, bulk copy, and index creation operations require workspace memory.The maximum workspace can be up to 75% of Target Server Memory.
Granted workspace memory is currently being used in the workspace.
The memory grants graph shows processes using and waiting to use workspace memory.
Cache Hit Ratios
Buffer Cache ratio shows the % of pages found in the buffer pool vs on disk.Generally lower percentages may indicate a lot of (slow) physical disk reads, which extra memory may alleviate.
Plan hit ration shows % of batches that have existing plans in the cache.
The higher the better as queries with existing plans will execute faster than those without.
Buffer Page Activity
The metrics display activity within the SQL Server memory buffer.Lookups are logical reads of data required to satisfy the query which may spill to disk.
Lazy Writes are the number of times per second SQL Server relocates dirty pages from buffer pool (memory) to disk. If it is above 20 then memory pressure may be present.
Read Ahead Pages are physically read from the disk as an internal performance enhancement.
Buffer IOs Sec
Physical reads and writes to and from the buffer cache.Because physical I/O is expensive, you may be able to minimize the cost by:
- Using a larger data cache
- Intelligent indexes
- More efficient queries
- Changing the database design
Page Life Expectancy
Number of seconds a page will stay in the buffer pool.This number can be extremely high, pages may stay in the cache for days, so there is no absolute number to look for, just large relative drops.
The average over the last hour is displayed, to help identify any drops.
OS Pages Sec (Hard Faults)
The rate at which pages are read from or written to disk.The average Pages/sec value should be below 50.
Memory pressure may be indicated by consistently high pages/sec.
Free List Stalls Sec
Number of requests per second that had to wait for a free page in the buffer pool.When no free pages in the buffer cache, the request is stalled and waits until a page in the buffer is freed.
The recommended value is 2 and under.
Properties
The properties on the right hand side of the dashboard give extra insight into the current state of extra memory objects:- SQL Cache - memory the server is using for the dynamic SQL cache
- Locks - dynamic memory the server is using for locks
- Connections - dynamic memory the server is using for maintaining connections
- Optomizer - dynamic memory the server is using for query optimization
- Cursor - memory consumed by cursors
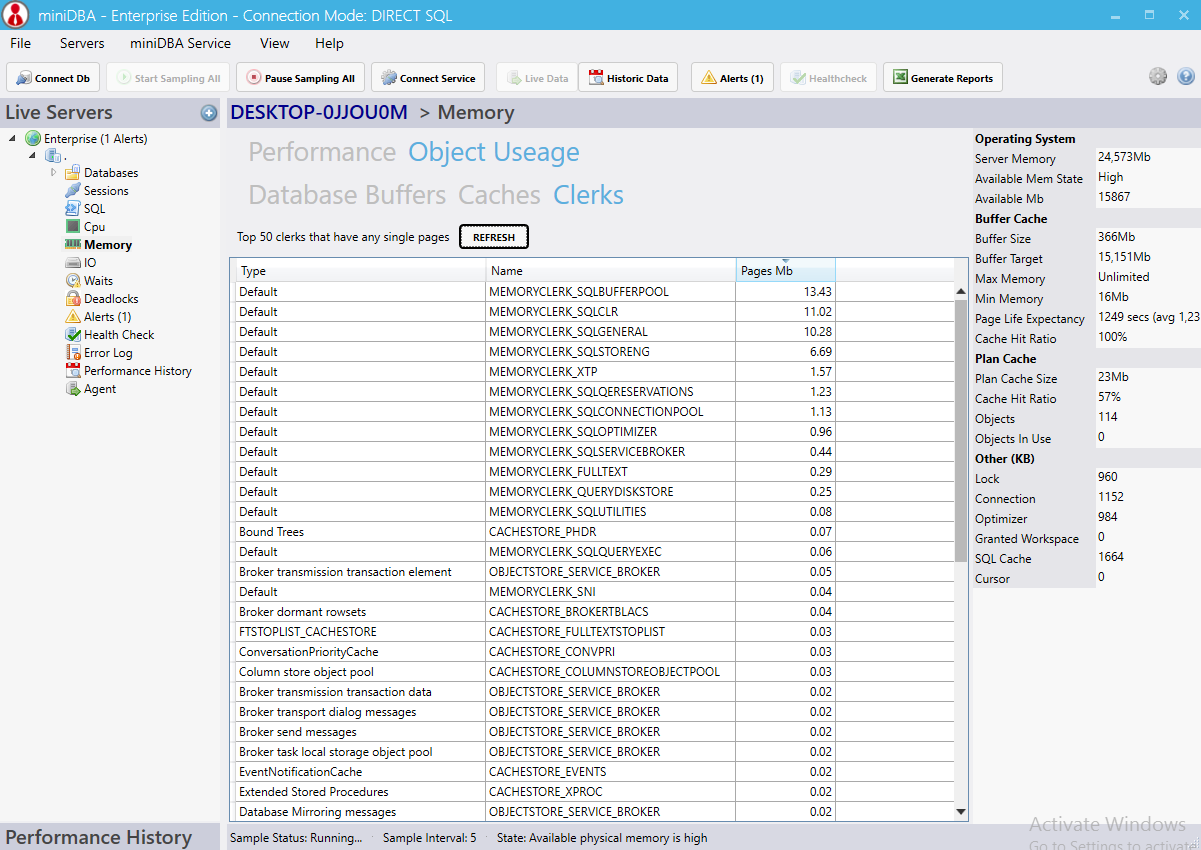
Object Usage Tab
Database Buffers
The grids will update when you click the "Refresh" button and will tell you Mb used per database.Caches
Caches are how internal plan memory is being consumed. Caches compete for memory and can cause other caches to get flushed. Performance degradation is likely when this occurs.SQL Server has a hard limit on all caches and soft limit on each individual cache. The hard limit changes from version to version and also the memory available. The soft limit is limited to 62.5% of total cache size. Any cache can grow to 62.5% of the total cache limit (hard limit).
Clerks
Every component that allocates a significant amount of memory must create its own memory clerk and allocate all its memory by using the clerk interfaces. This is a good view to investigate memory pressure as the largest memory allocations will be at the top of the data grid.