Server Dashboard
Activity
Live Query Statistics
Profiler
Server Memory
Waits
Error Log
Cpu
IO
SQL Queries
Healthcheck
Databases
Database
Tables/Partitions
Index Use
Index Fragmentation
Files
Locks
Memory
SQL Queries
Default Trace
Transaction Log
Healthcheck
Execution Plan View
Index Maintenance
Manual Index Analysis
Index Defragmentation Jobs
Alerts
Configuration
Slack Integration
Teams Integration
Custom SQL Alerts
Maintenance Windows
SQL Server Alerts List
The Active SQL tab of the history viewer displays active sql statements (requests) over the course of the selected timeframe.
The graph and grid at the top of the screen displays the number of active statements at a point in time. Clicking on the graph will highlight that sampled minute in the grid.

Clicking on a statement in the grid will display all active requests occuring at that point in time in the next grid in the middle of the screen:

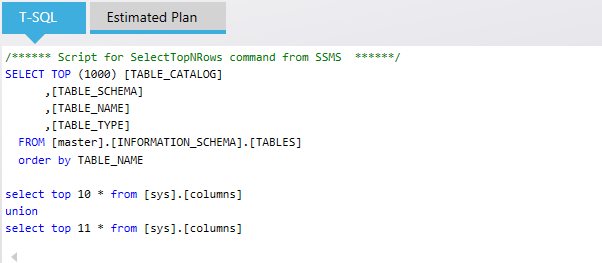
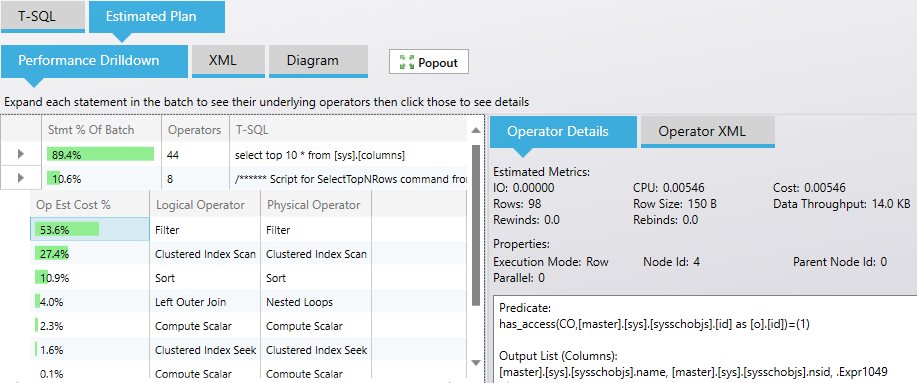
If more than 1 request was occurring it allows you to select an individual request and then view its T-SQL and execution plan in the lower part of the screen:


The graph and grid at the top of the screen displays the number of active statements at a point in time. Clicking on the graph will highlight that sampled minute in the grid.

Clicking on a statement in the grid will display all active requests occuring at that point in time in the next grid in the middle of the screen:

If more than 1 request was occurring it allows you to select an individual request and then view its T-SQL and execution plan in the lower part of the screen:

