Screenshots
Explore the current Mini DBA Console across estate monitoring, supported database platforms, live activity, waits, and execution-plan analysis. Select any screenshot to open the full-size gallery.
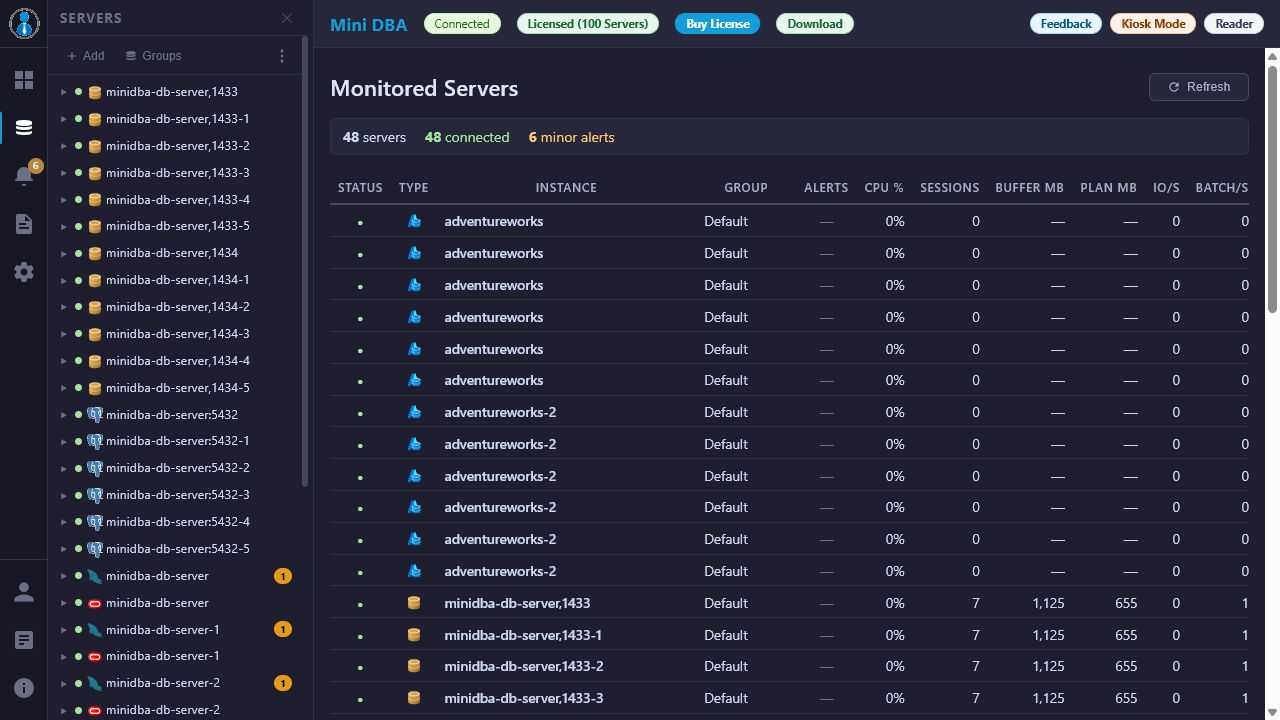
Monitored Servers
See connection status, database type, alerts, CPU, sessions, memory, and throughput across the estate.
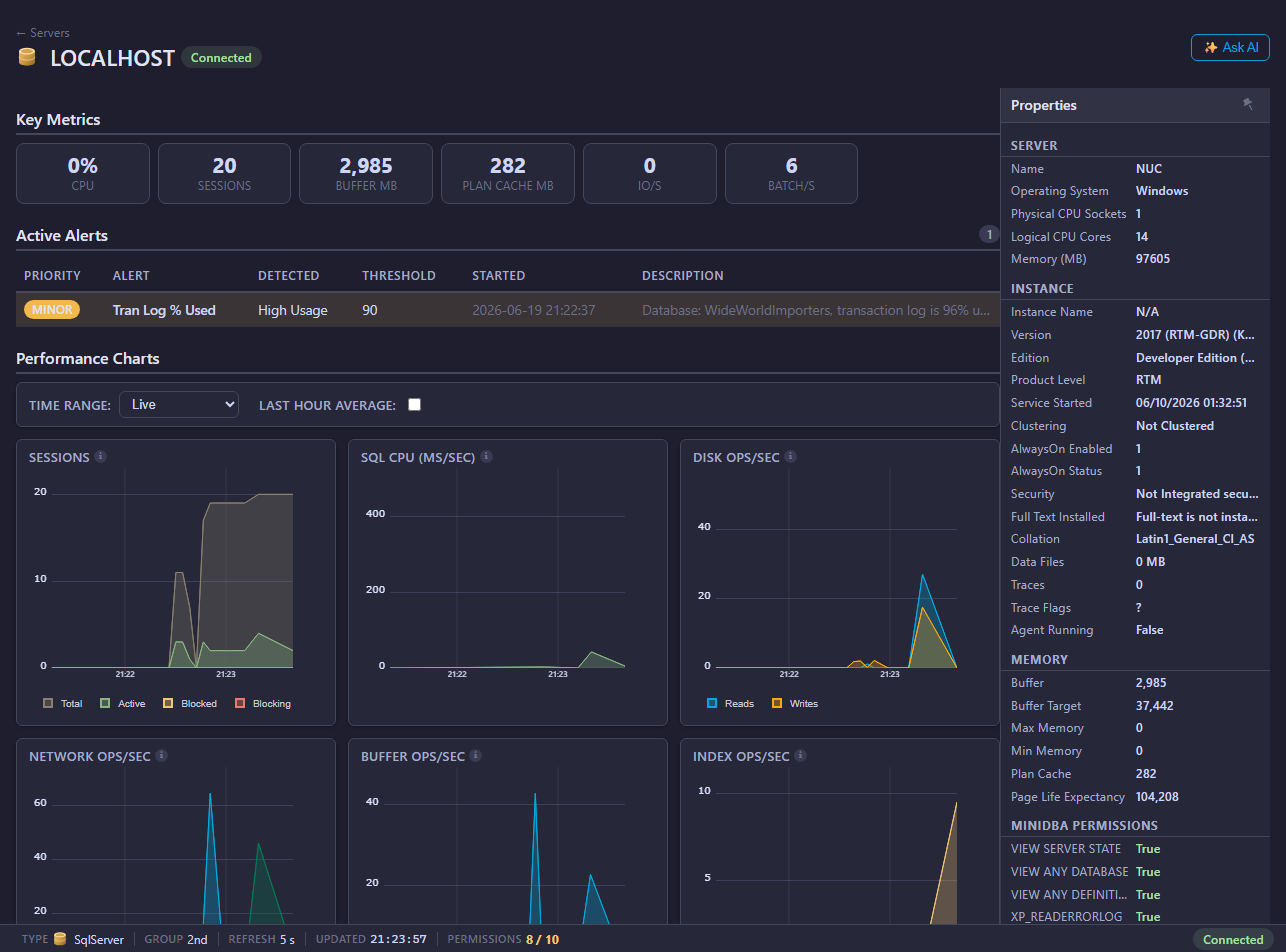
SQL Server Overview
Key metrics, active alerts, live performance charts, server properties, memory, and permissions.
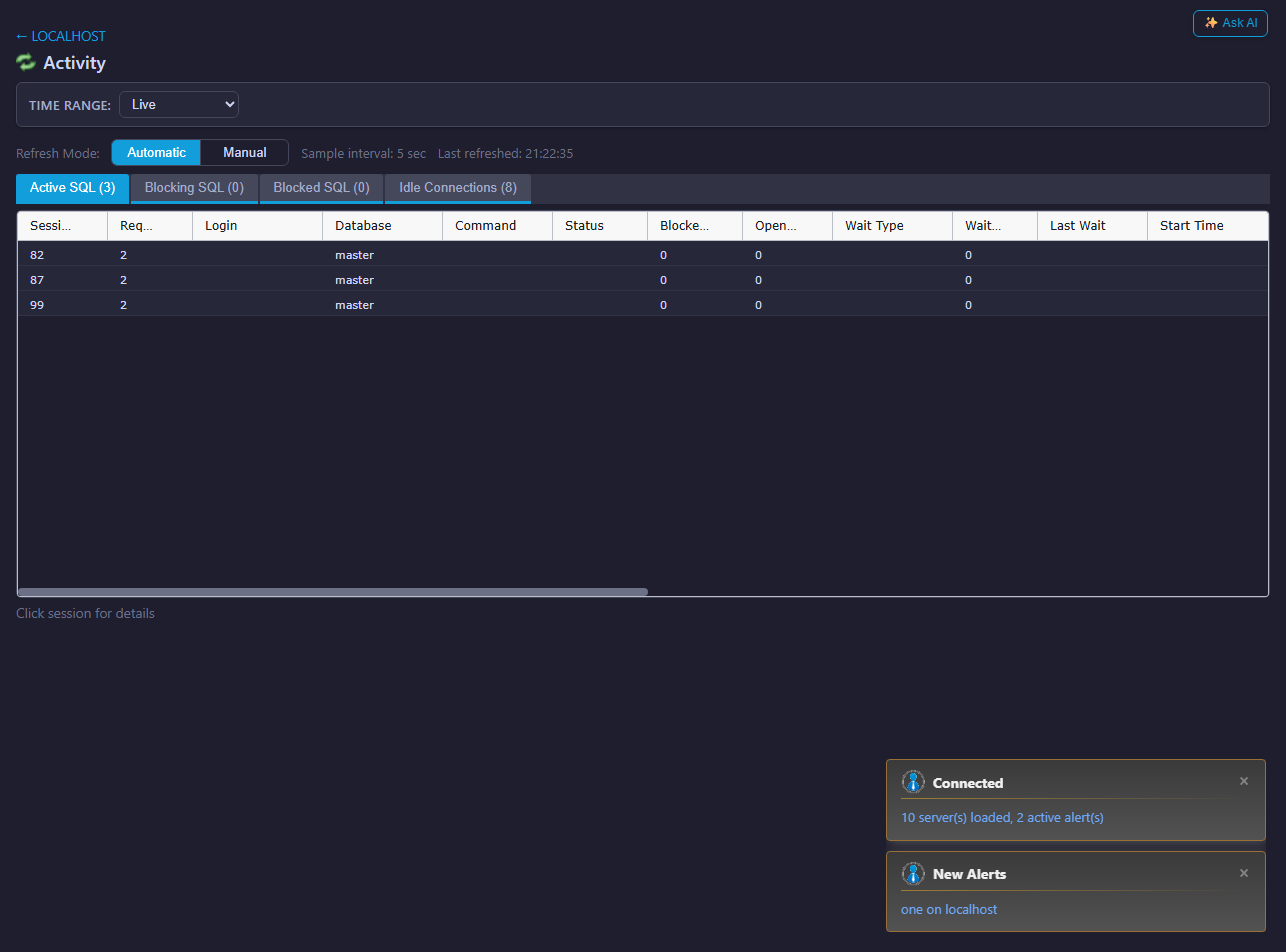
Live SQL Server Activity
Inspect active, blocking, blocked, and idle sessions with automatic or manual refresh.
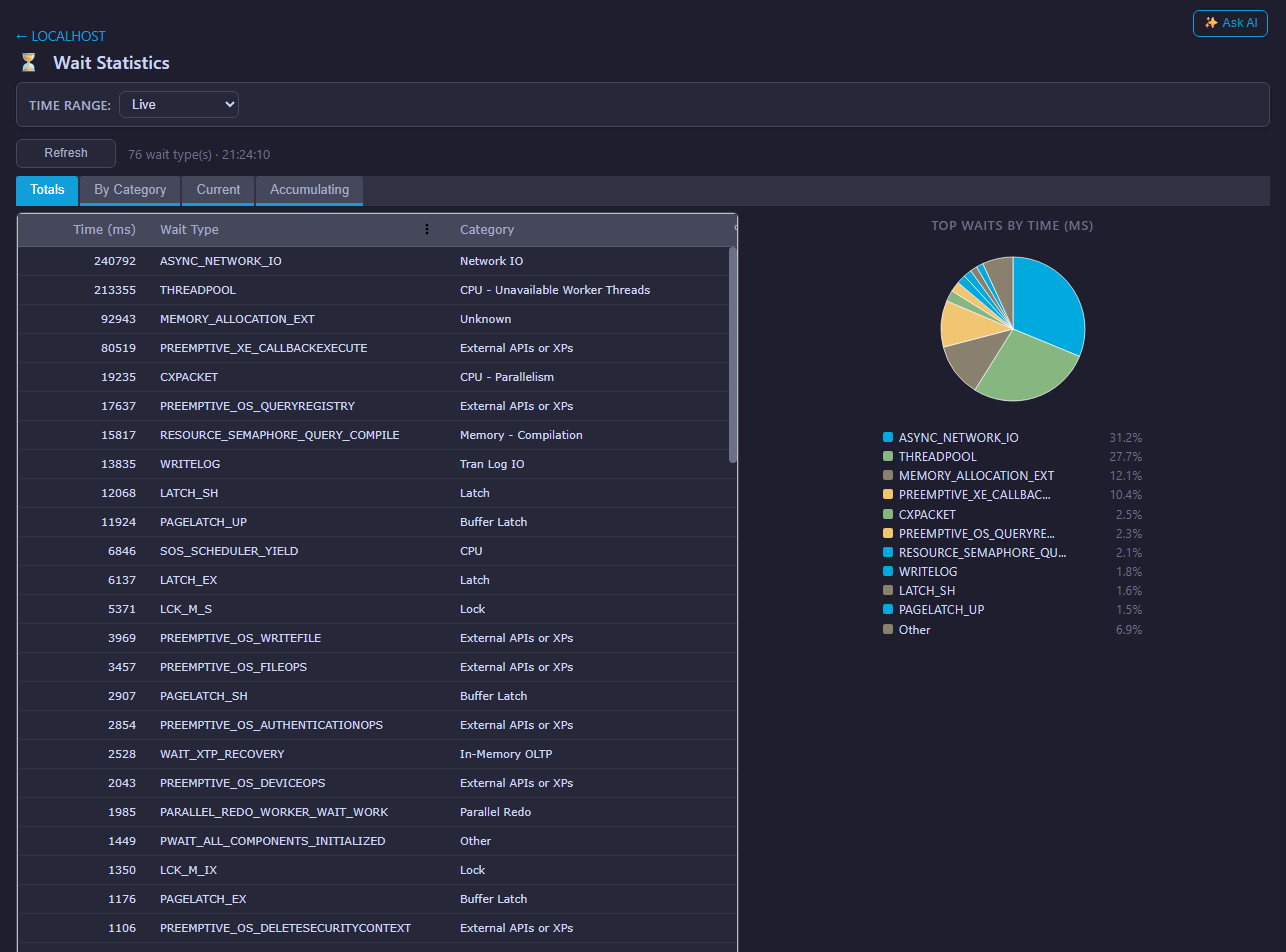
Wait Statistics
Rank SQL Server waits by elapsed time and category with a visual distribution of the top waits.
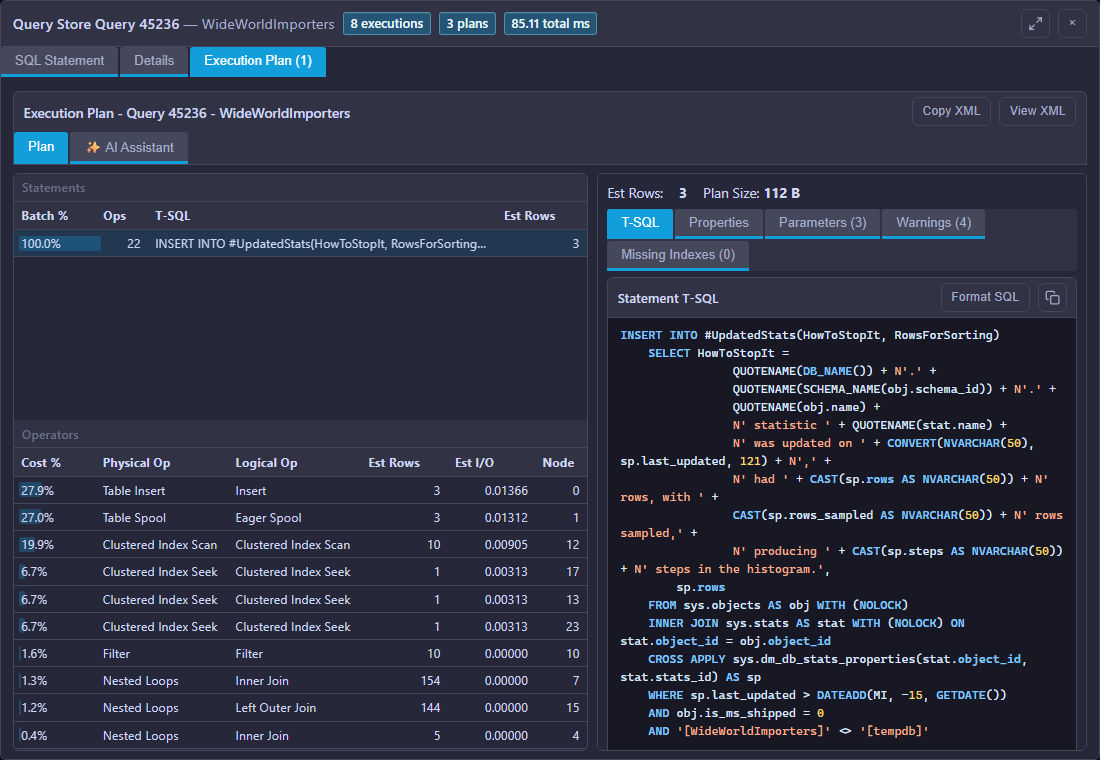
Execution Plan Analysis
Examine statements, operators, estimated rows, properties, parameters, warnings, and formatted SQL.
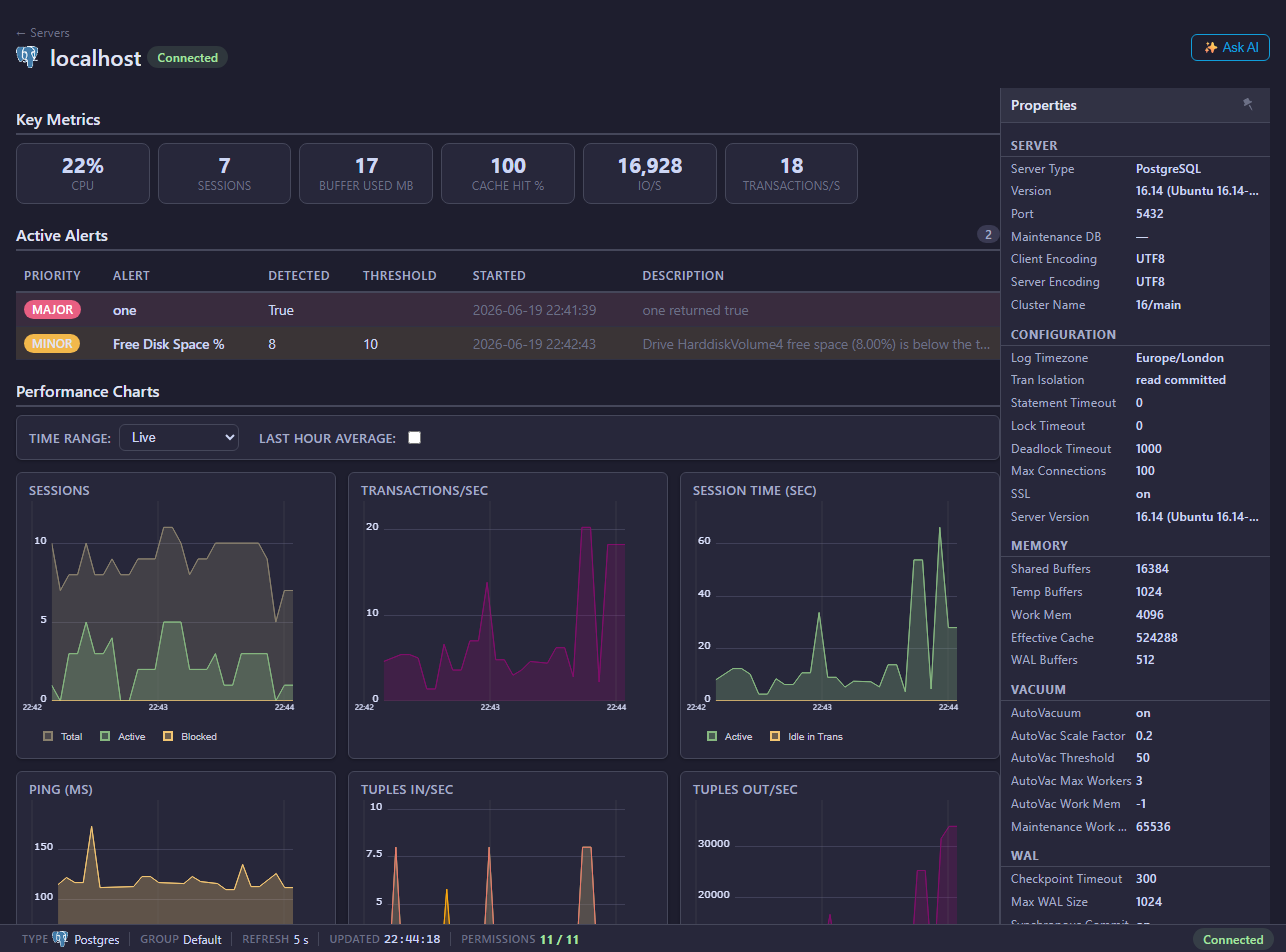
PostgreSQL Overview
Monitor sessions, transactions, I/O, tuple activity, alerts, memory, vacuum, and WAL configuration.
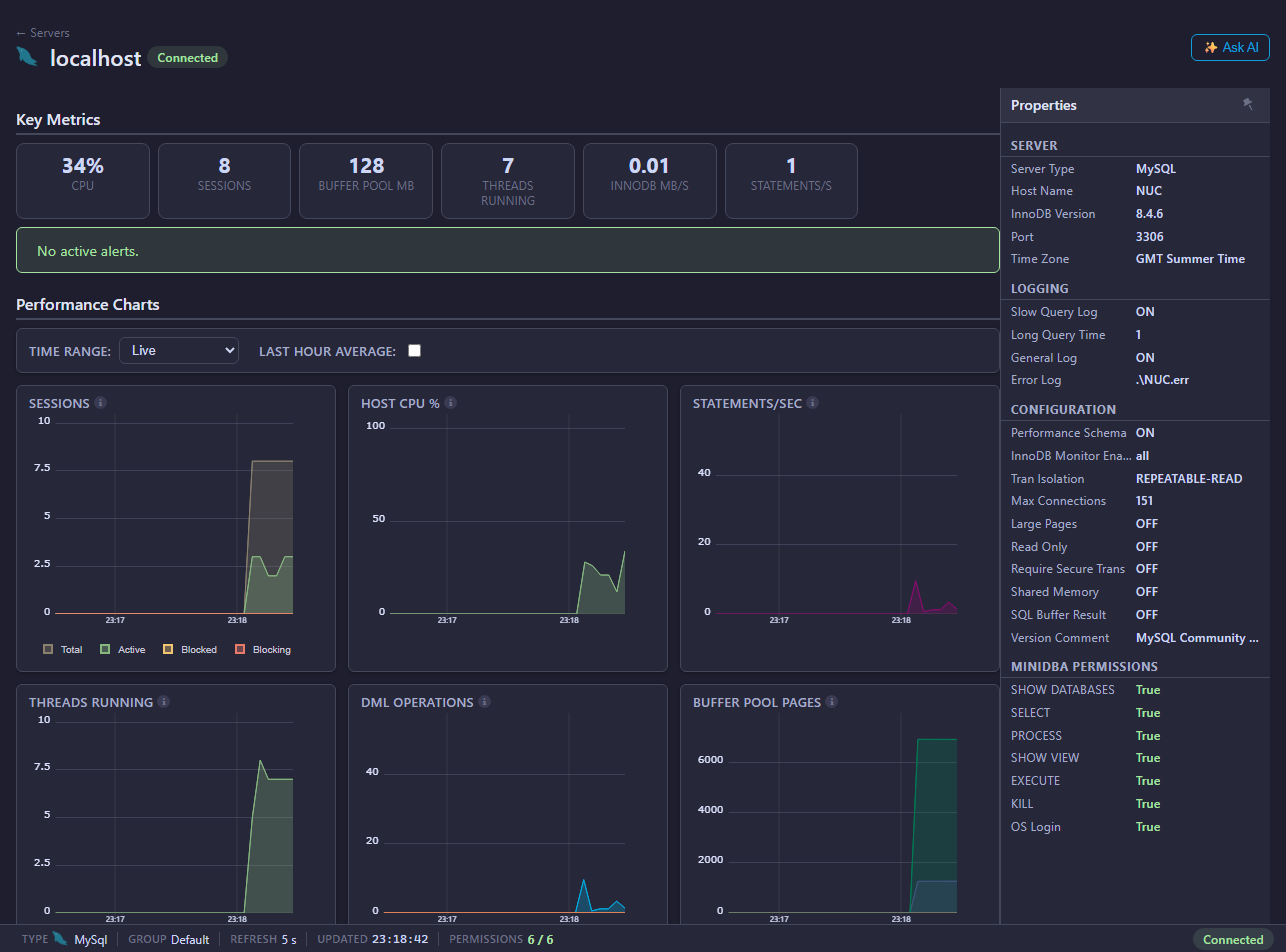
MySQL and MariaDB Overview
Track sessions, host CPU, statements, running threads, DML operations, buffer pools, and permissions.
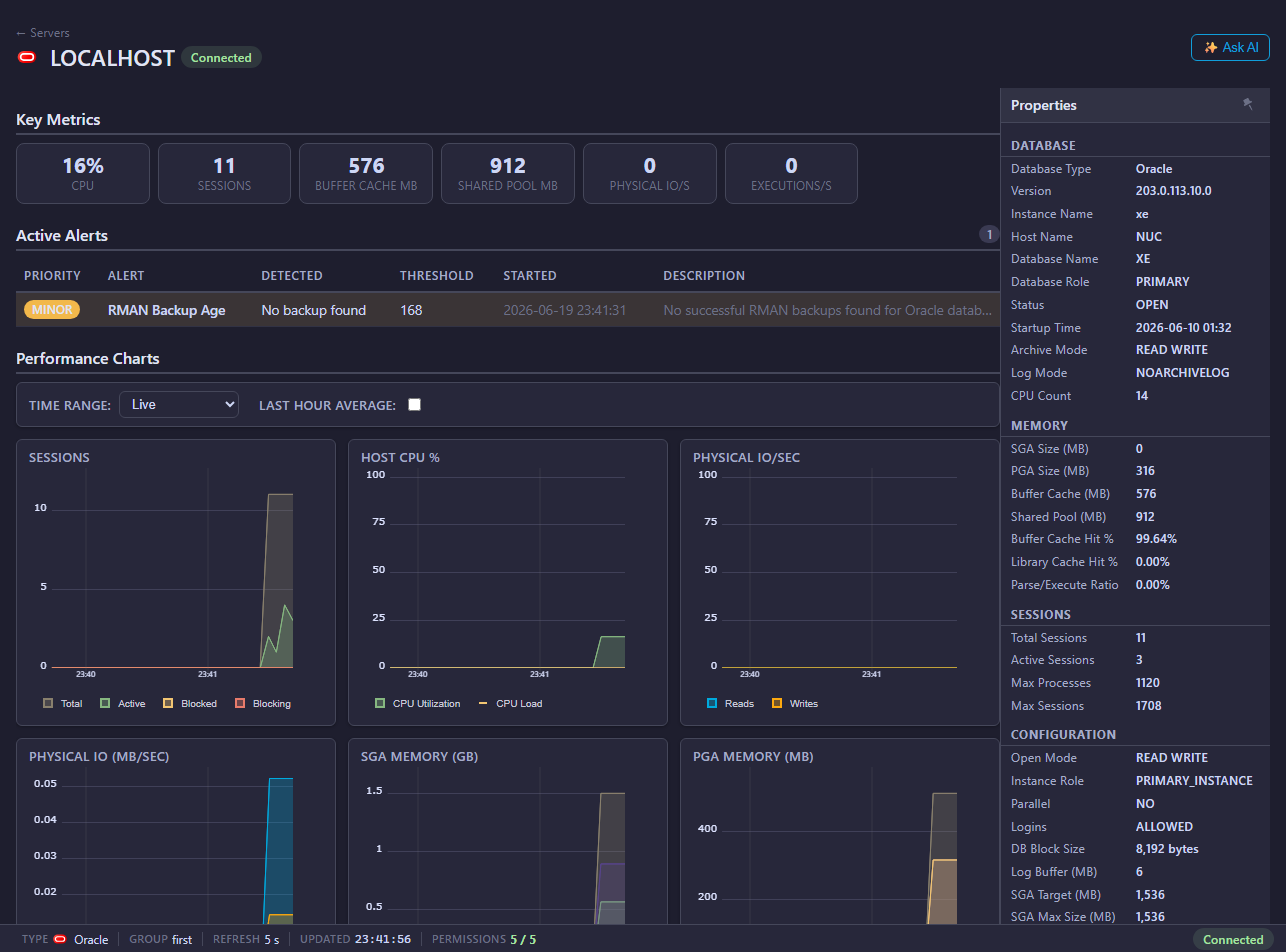
Oracle Overview
Review active alerts, sessions, CPU, physical I/O, SGA and PGA memory, database properties, and limits.
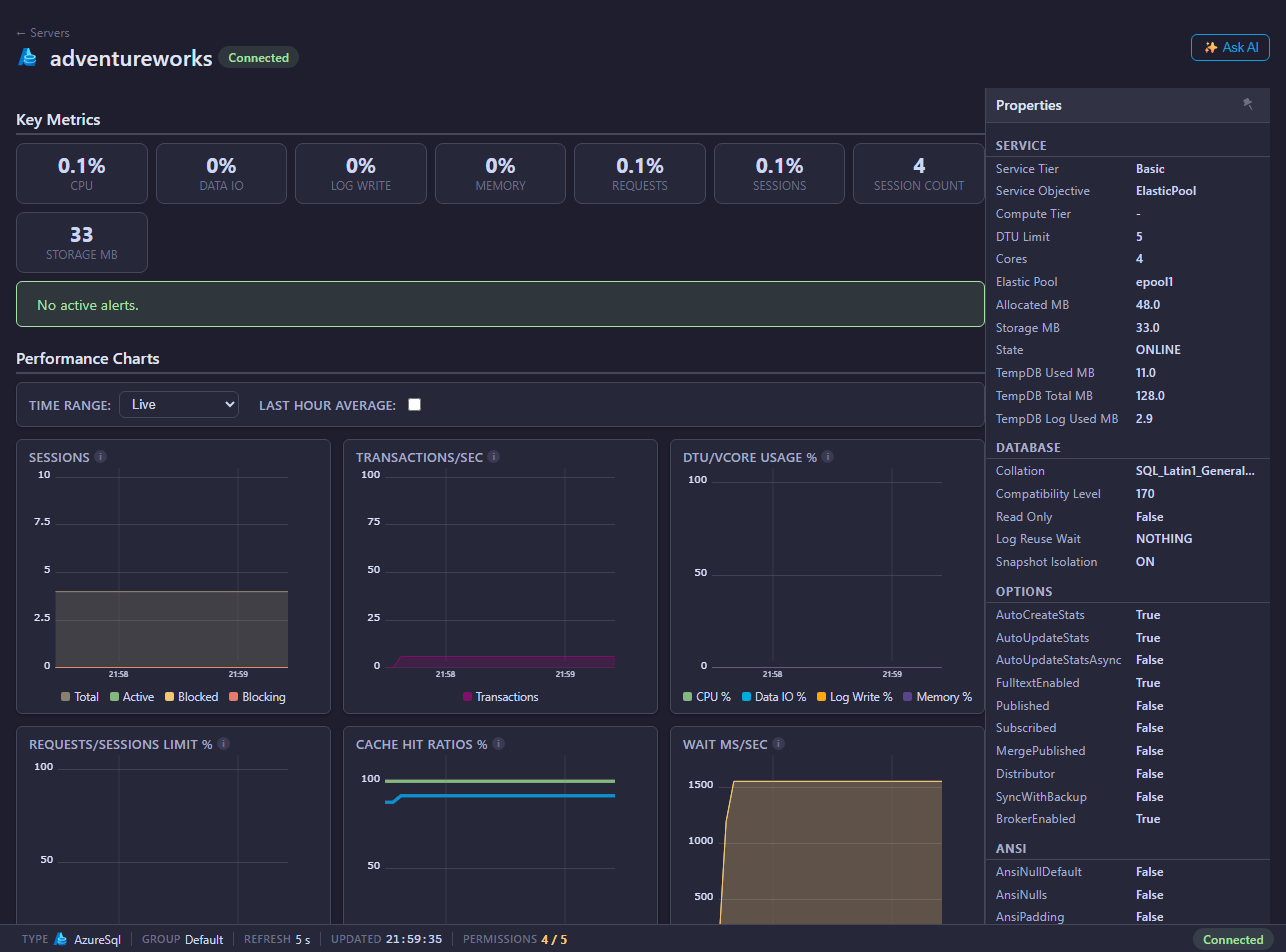
Azure SQL Overview
Monitor sessions, transactions, DTU or vCore usage, cache ratios, waits, service properties, and options.