Server Dashboard
Activity
Live Query Statistics
Profiler
Server Memory
Waits
Error Log
Cpu
IO
SQL Queries
Healthcheck
Databases
Database
Tables/Partitions
Index Use
Index Fragmentation
Files
Locks
Memory
SQL Queries
Default Trace
Transaction Log
Healthcheck
Execution Plan View
Index Maintenance
Manual Index Analysis
Index Defragmentation Jobs
Alerts
Configuration
Slack Integration
Teams Integration
Custom SQL Alerts
Maintenance Windows
SQL Server Alerts List
This is a continuation of the framework to SQL Server performance tuning with miniDBA (Get it here). Read part 1 here.
The first part focussed on server level performance issues, this part will look at the database level and all the tools miniDBA provides to find problems.

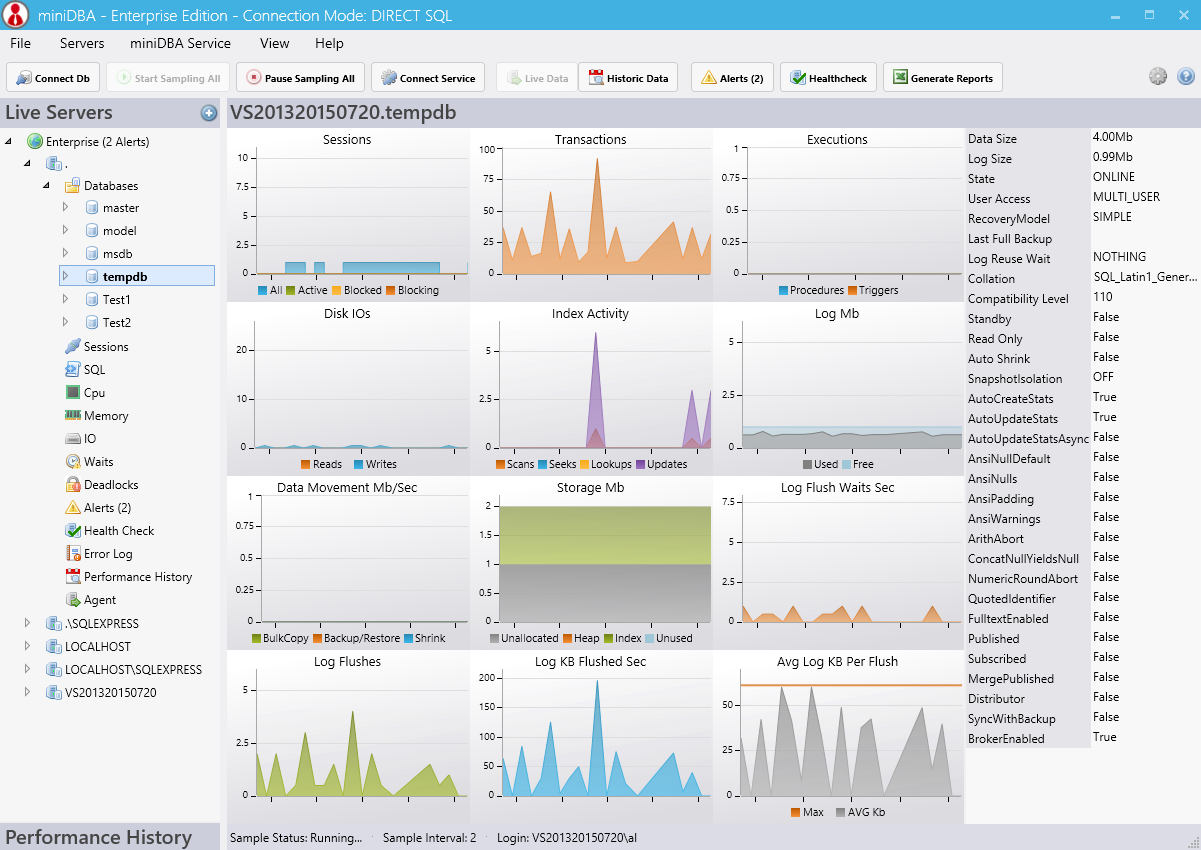
The above screenshot gives you an idea of the information available in this screen. Pay particular attention to very high log use percentages and IO activity. These are key indicators of potentially performance hitting loads.
- blocking connections - these can't be totally avoided but can be reduced
- High disk reads - replacing disk reads with buffer reads where possible will speed up queries
- More index scans then seeks - queries are a lot faster when they seek instead of scan
- Very high log use percentage - the log cannot be backup up with a constantly open transaction at will become a bottleneck when full
- Any shrinks - indexes will be horribly fragmented, rarely a good idea
- Unexpected database backups - IO may become a bottleneck while a backup is performed for any files on that drive
- Unexpected trigger executions - legacy & undocumented triggers may no longer be needed
Check the database properties to make sure you are aware of the following:
- Recovery model - do you have non-production databases with unnecessary full recovery model?
- Last Full Backup - make sure you are doing this regularly where needed
- Auto Shrink - rarely a good idea owing to the fact it will fragment your indexes
- Snapshot Isolation - this may help blocking issues, use with caution as it will put extra load on TempDb
- Auto Create Stats - if this is disabled you need to ensure there is a job that updates them on a schedule
- Publisher/Subscriber - be aware of the expected loads from replication

Clicking on a row in the grid will show you the entire T-SQL statement in the textbox at the bottom of the screen.
You can see how much CPU, IO & memory a connection has used and how long the batch has been running for here. Dig into the details of any particularly high consumers from here.
Pay special attention to locks of type X - exclusive locks are not shared and are at high risk of blocking. Whatever operation has taken these locks may benefit from having its T-SQL re-factored to operate on more finely grained units of data. A set or rows per transaction instead of a whole table for example.

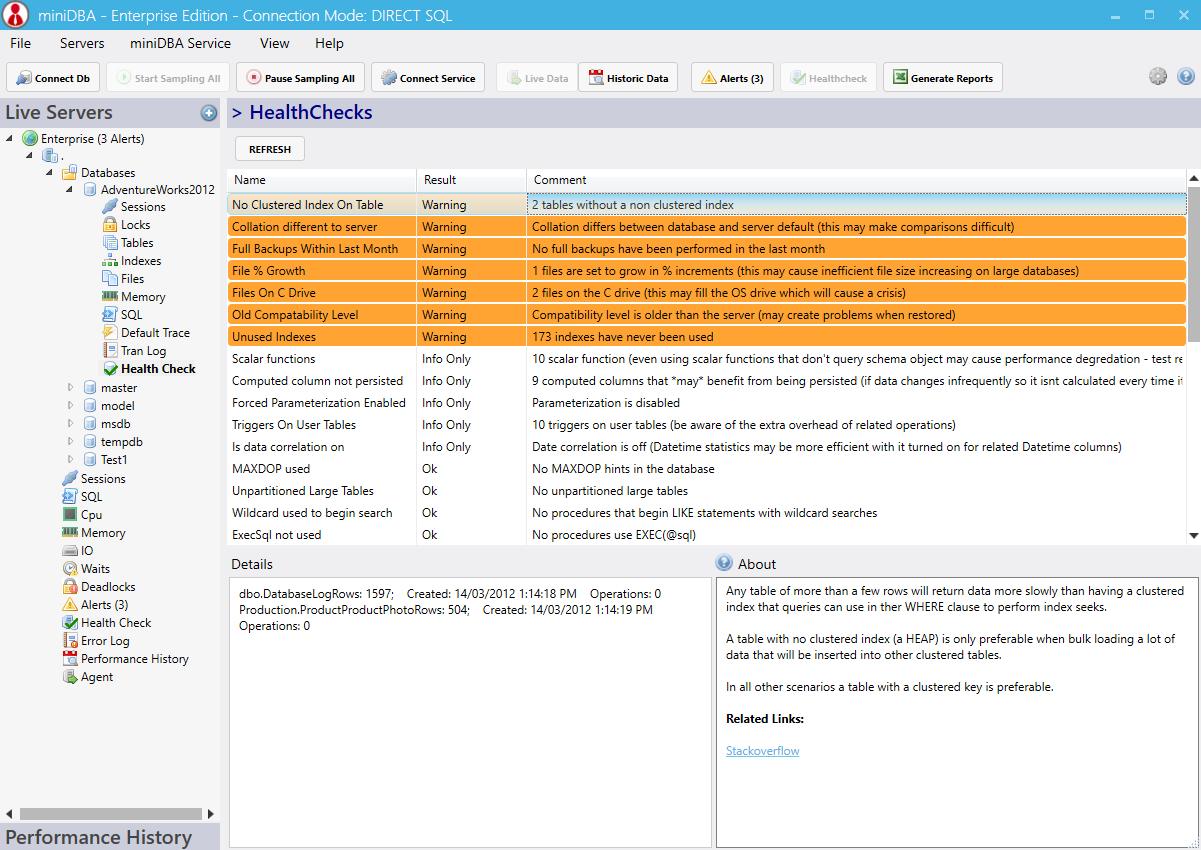
The diagnostic checks can be seen individually in the screenshot below:
Any warnings should either be dealth with or understood what their implications are.
Continue to part 3...(soon)
The first part focussed on server level performance issues, this part will look at the database level and all the tools miniDBA provides to find problems.
8. Which Database?
If you are not sure which database is causing your server to have problems you can view each database side by side in the databases screen. It allows you to compare databases for current activity and tell which ones have the highest load.
The above screenshot gives you an idea of the information available in this screen. Pay particular attention to very high log use percentages and IO activity. These are key indicators of potentially performance hitting loads.
9. Database Dashboard
Use the database dashboard to get an overview of an individual database. Look for:- blocking connections - these can't be totally avoided but can be reduced
- High disk reads - replacing disk reads with buffer reads where possible will speed up queries
- More index scans then seeks - queries are a lot faster when they seek instead of scan
- Very high log use percentage - the log cannot be backup up with a constantly open transaction at will become a bottleneck when full
- Any shrinks - indexes will be horribly fragmented, rarely a good idea
- Unexpected database backups - IO may become a bottleneck while a backup is performed for any files on that drive
- Unexpected trigger executions - legacy & undocumented triggers may no longer be needed

Check the database properties to make sure you are aware of the following:
- Recovery model - do you have non-production databases with unnecessary full recovery model?
- Last Full Backup - make sure you are doing this regularly where needed
- Auto Shrink - rarely a good idea owing to the fact it will fragment your indexes
- Snapshot Isolation - this may help blocking issues, use with caution as it will put extra load on TempDb
- Auto Create Stats - if this is disabled you need to ensure there is a job that updates them on a schedule
- Publisher/Subscriber - be aware of the expected loads from replication
10. Connections
Most importantly you can see which connections/sessions are blocking other and what T-SQL they are running.
Clicking on a row in the grid will show you the entire T-SQL statement in the textbox at the bottom of the screen.
You can see how much CPU, IO & memory a connection has used and how long the batch has been running for here. Dig into the details of any particularly high consumers from here.
11. Locks
If any connections are blocking or deadlocking others it may well be due to locks they have taken. Use the session_id column in the Locks screen to find locks that have been taken by troublesome sessions.Pay special attention to locks of type X - exclusive locks are not shared and are at high risk of blocking. Whatever operation has taken these locks may benefit from having its T-SQL re-factored to operate on more finely grained units of data. A set or rows per transaction instead of a whole table for example.
12. Indexes
Use the indexes screen to find the following types of index: - Unused - indexes that have never been used are pointless and take time to insert/update. Drop them. - Missing - experiment with recommended indexes, make sure they get used before committing to having them. you can gain easy performance wins here. - fragmented - highly fragmented indexes will perform poorly. ensure you have a maintenance job to reindex />rebuild them.13. Files
Use the files screen to find slow average reads and writes. The importance of these files is compressed by how much activity they have so take the number of reads and writes into account.14. Memory
Any objects that have a name of 'Heap' are tables that have no clustered index. Only tiny tables are viable as heaps:- use the size related columns to assess the impact of any heaps and think about putting a clustered index on them.
15. Database Health Check
Much like the server level healthcheck, the database level healthcheck will analyse a database for potential configuration and code optimizations.The diagnostic checks can be seen individually in the screenshot below:

Any warnings should either be dealth with or understood what their implications are.
Continue to part 3...(soon)