Server Dashboard
Activity
Live Query Statistics
Profiler
Server Memory
Waits
Error Log
Cpu
IO
SQL Queries
Healthcheck
Databases
Database
Tables/Partitions
Index Use
Index Fragmentation
Files
Locks
Memory
SQL Queries
Default Trace
Transaction Log
Healthcheck
Execution Plan View
Index Maintenance
Manual Index Analysis
Index Defragmentation Jobs
Alerts
Configuration
Slack Integration
Teams Integration
Custom SQL Alerts
Maintenance Windows
SQL Server Alerts List
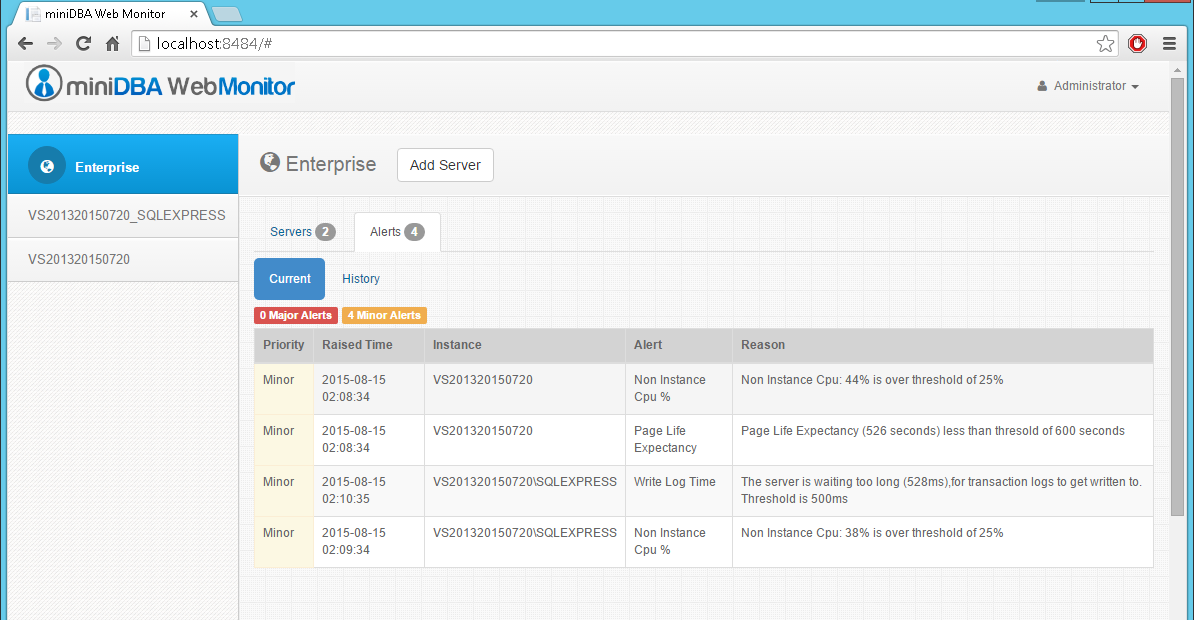
The current alerts can be viewed at enterprise level or for a single sql server. The number in the tab header displays the amount of currently active alerts.

The alerts are color coded red and yellow depending if they are of major or minor priority.

The alerts are color coded red and yellow depending if they are of major or minor priority.