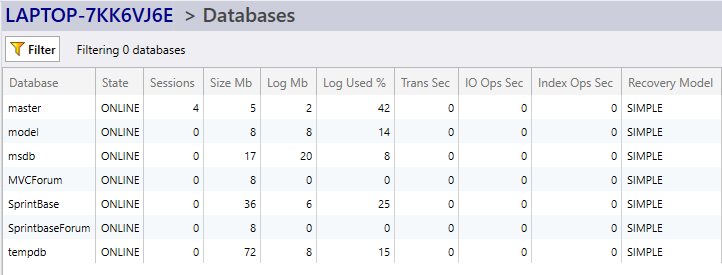
Click the databases node to see the databases data grid. You can see storage and activity of every databases in the instance side by side. This gives a unique live view of all databases state and performance:
Fields
- Database: Db name.
- State: Database state - anything other than ONLINE will need attention.
- Sessions: Number of sessions that are currently in the database. This is a good indicator of how busy a database is.
- Size Mb: Data storage size on disk.
- Log Mb: Log storage size on disk.
- Log Used %: How full the transaction log is.
- Trans Sec: Transactions complete per second. A great indicator of how busy and how capable the database is in terms of processing data.
- IO Ops Sec: Input/Output operation per second. How many reads and writes are occuring to disk. Constant high values may mean indexes need tuning and/or storage disk hardware may need upgrading or the database having not sharing a disk.
- Index Ops Sec: Index operations per second.
- Recovery Model: Are any databases in simple mode when they should really be in full mode? Quickly scan all your databases here.