Live dashboards
Follow connections, CPU, waits, memory, storage, throughput and workload activity with database-specific dashboards and more than 100 collected metrics.
Mini DBA brings live monitoring, history, alerts and guided investigation together in one browser-based console. Monitor mixed database estates without switching between a different tool for every platform.
Move from a high-level estate view to the detail behind an individual database problem.
Follow connections, CPU, waits, memory, storage, throughput and workload activity with database-specific dashboards and more than 100 collected metrics.
The Mini DBA Engine keeps collecting while nobody has the Console open, preserving history and evaluating alerts around the clock.
Monitor SQL Server, PostgreSQL, MySQL and MariaDB, Oracle, and Azure SQL from the same Console.
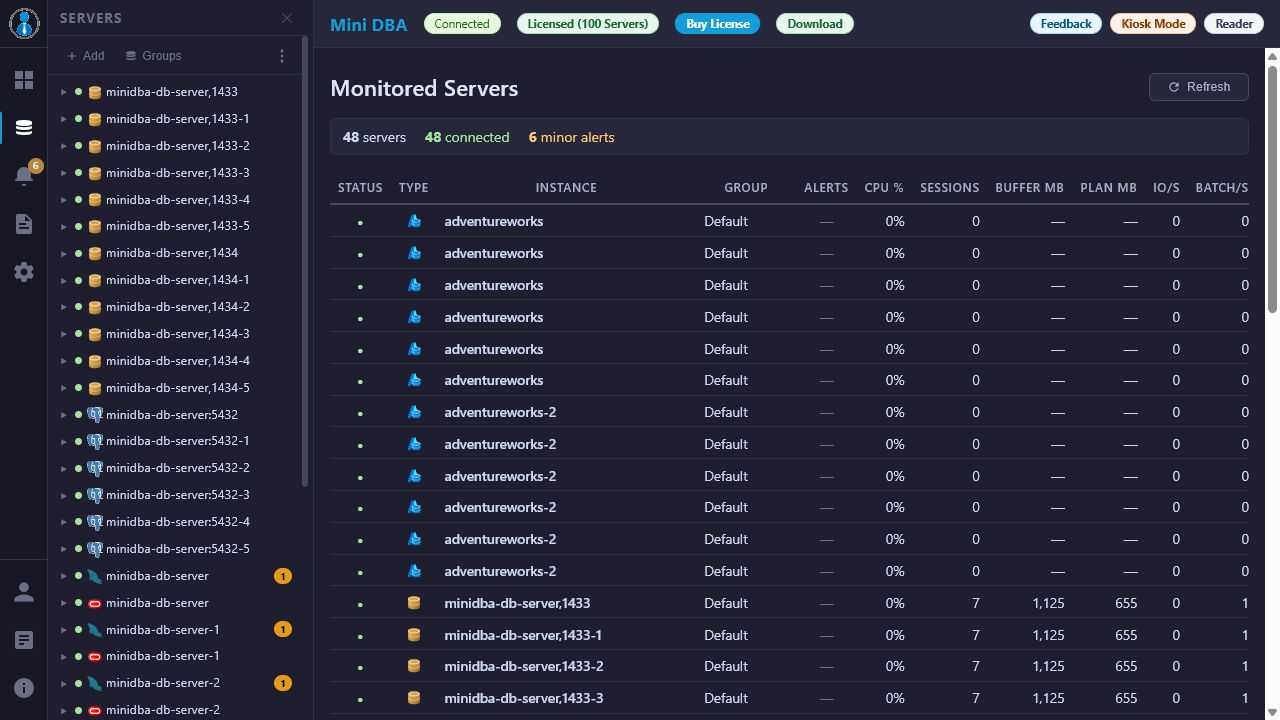
Start with the affected server, database or alert, then work through the evidence without assembling a collection of diagnostic scripts.
Investigate SQL Server memory pressure or run repeatable SQL Server health checks.
Explore a populated Console online, or install Mini DBA and connect the database platforms you operate.
TRY ONLINE DEMO Download Mini DBA
The AI Assistant helps turn monitoring evidence into a focused investigation while keeping the database context close to the question.
Keep enough context to understand what happened, notify the right people and manage monitoring across environments.
Review earlier workload, waits, queries, alerts and deadlocks to investigate intermittent issues and compare performance over time.
Use alert presets, configurable thresholds and maintenance windows, then deliver notifications through the integrations used by your team.
Connect a Console to multiple Engines when an advanced environment needs separate monitoring locations or network boundaries.
No separate logging database is required. Install Mini DBA in a few clicks and the Engine manages its own monitoring history and configuration.
Use a problem-led workflow across SQL Server, PostgreSQL, MySQL, MariaDB, Oracle and Azure SQL.
Find the lead blocker and understand every waiting session.
Investigate blocking →Preserve participants, statements and resources after the event.
Analyse deadlocks →Prioritise expensive workload and inspect execution plans.
Analyse queries →Reconstruct incidents after the live symptoms have gone.
Explore history →