The server waits screen is broken into Total \ Current \ Accumulating \ Queue tabs.
The Total tab shows all waits since the server was restarted in a grid on the left and pie chart on the right.
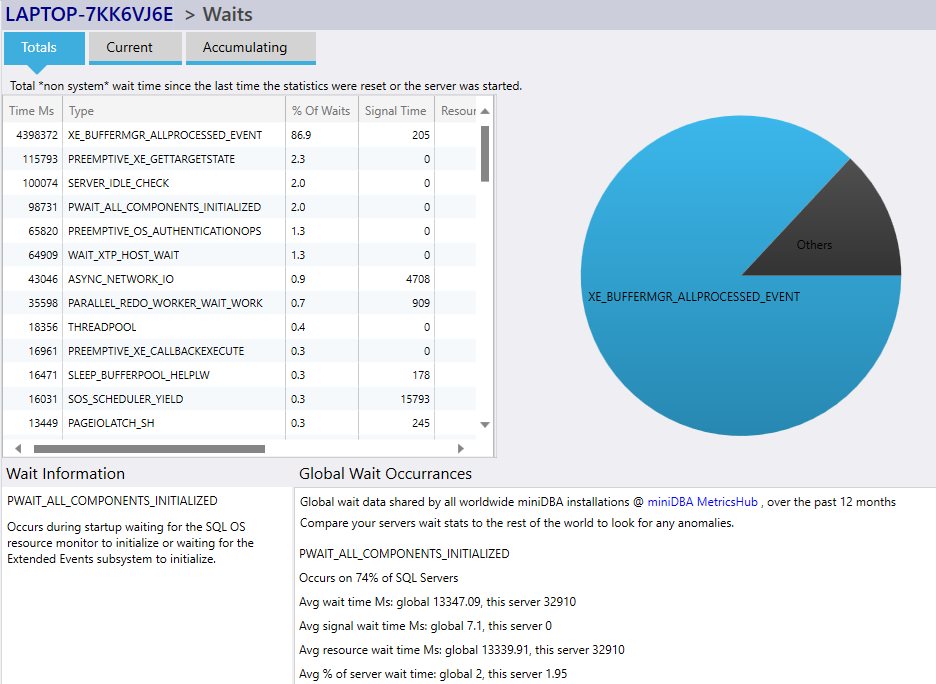
When a wait is clicked its details will be shown at the bottom of the screen. On the left is a description of the wait type, on the right are metrics that miniDBA has gathered globally over all installations about that type under "Global Wait Occurrances"
The current tab displays the waits currently occuring.
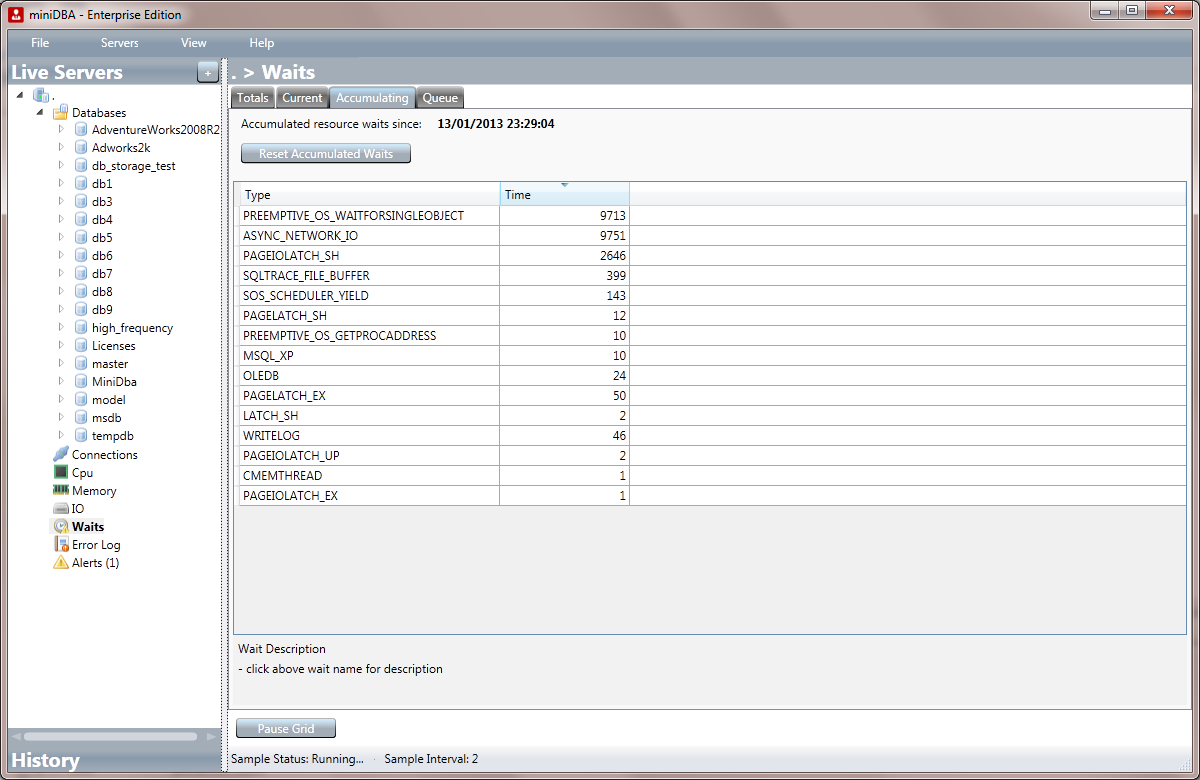
The accumulating tab displays the waits since miniDBA was started.
Click the reset button to reset the accumulaing waits to zero.
The queue tab shows waits currently being waited on by the resource queue.
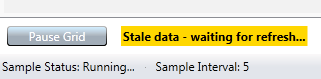
Note that the monitored server is not asked for the waits information unless the waits screen is shown. This means any data shown as soon as you display the screen is as old as last time you viewed the waits screen.
Fresh data won't be got until the next server sample, how long that is depends on your settings.
Until the fresh wait information is displayed on the screen you will see informational text telling you the current data is stale: