Server Dashboard
Activity
Live Query Statistics
Profiler
Server Memory
Waits
Error Log
Cpu
IO
SQL Queries
Healthcheck
Databases
Database
Tables/Partitions
Index Use
Index Fragmentation
Files
Locks
Memory
SQL Queries
Default Trace
Transaction Log
Healthcheck
Execution Plan View
Index Maintenance
Manual Index Analysis
Index Defragmentation Jobs
Alerts
Configuration
Slack Integration
Teams Integration
Custom SQL Alerts
Maintenance Windows
SQL Server Alerts List
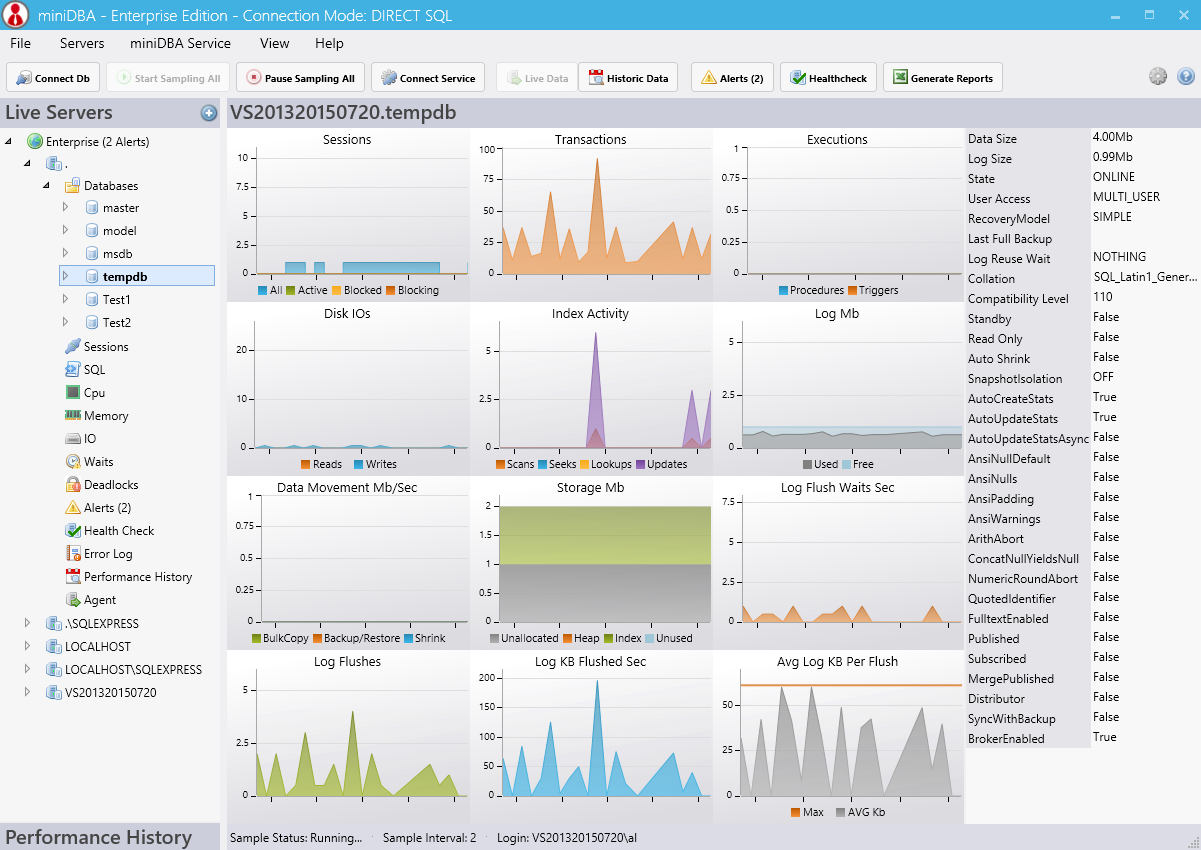
The Database Dashboard displays information specific to an individual database.

Mouse over any graphs for details of the underlying counters.
Activity counters such as transactions & log flushes are the 'Per Second' values, therefore you may see values of less than 1 depending on you sample interval.
Mouse over any property labels to be given a link to the associated MSDN article for the property.
The properties can be hidden by clicking on the properties divider bar.