Server Dashboard
Activity
Live Query Statistics
Profiler
Server Memory
Waits
Error Log
Cpu
IO
SQL Queries
Healthcheck
Databases
Database
Tables/Partitions
Index Use
Index Fragmentation
Files
Locks
Memory
SQL Queries
Default Trace
Transaction Log
Healthcheck
Execution Plan View
Index Maintenance
Manual Index Analysis
Index Defragmentation Jobs
Alerts
Configuration
Slack Integration
Teams Integration
Custom SQL Alerts
Maintenance Windows
SQL Server Alerts List
The Live Query Statistics viewer is available in both the server and database level "Activity" view that shows live/executing SQL requests.
It is loaded by clicking on any SQL request.
The functionality of this view is intended to focus on identifying the active operators in a live request quickly and verifying the accuracy of the estimated execution plan versus actual execution.

Execution plan operator reference list on MSDN
The performance related columns for each execution plan operator are:
This functionality is available in the free single sql connection version of miniDBA Desktop and above.
The functionality of this view is intended to focus on identifying the active operators in a live request quickly and verifying the accuracy of the estimated execution plan versus actual execution.
Availability
Live Query Statistics are only available in miniDBA when connected to SQL Server 2016 SP1 and above. The SQL Server must have Trace Flag 7412 (Lightweight statistics profiling infrastructure) enabled. Use the following T-SQL to enable the flag:
DBCC TRACEON (7412, -1);
Plan Operators
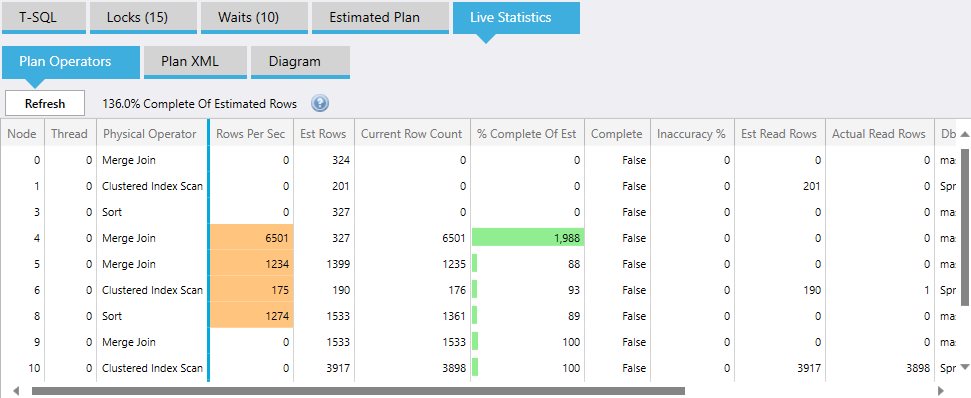
The viewer defaults to showing the "Plan Operators" tab which shows each operator on the left. Any operators that have complete execution are listed first, this can be seen by looking at the "Complete" column.
Execution plan operator reference list on MSDN
The performance related columns for each execution plan operator are:
- Rows Per Sec: Data throughput of the operator and is colored orange if there is any activity. This allows you to easily identify the operators that are currently active.
- Est Rows: Amount of rows expected to be processed based on the stored estimated execution plan. This meta data comes from column statistics and is frequently out of date leading to estimated and actual number of rows being different.
- Current Row Count: Amount of rows that have been processed by the operator so far.
- % Complete of Estimated: Current row count compared to estimated rows. This % may become extremely high if index statistics are out of date and the estimated rows are significantly smaller than the actual rows.
- Complete: All rows have been processed for that operator
- Inacurracy %: When complete shows how inaccurate the estimate row count is. Use this to reindex or update statistics, the more inaccurate the more you need to get the statistics updated.
- Db Name: Database the operator is operating in.
- Object:Optional - may be a table.
- Index:Optional - operator may be using an index.
- Index Type:Optional - heap or clustered.
- Statistics Date:Date the the index statistics were last updated - the newer the better.
XML
The execution plan XML is shown in the next tab along "XML".Diagram
Click the "Open in Graphical Tool" button to open the plan as a .sqlplan file in Windows. If SQL Management studio or other application is installed and registered to handle .sqlplan files that app will show the plan.This functionality is available in the free single sql connection version of miniDBA Desktop and above.