Server Dashboard
Activity
Live Query Statistics
Profiler
Server Memory
Waits
Error Log
Cpu
IO
SQL Queries
Healthcheck
Databases
Database
Tables/Partitions
Index Use
Index Fragmentation
Files
Locks
Memory
SQL Queries
Default Trace
Transaction Log
Healthcheck
Execution Plan View
Index Maintenance
Manual Index Analysis
Index Defragmentation Jobs
Alerts
Configuration
Slack Integration
Teams Integration
Custom SQL Alerts
Maintenance Windows
SQL Server Alerts List
The deadlocks tab of the history viewer displays the sql server deadlock history over the course of miniDBAs monitoring.
The main server dashboard in miniDBA displays real time deadlocks but the history viewer is where to find any deadlocks that occurred more than a minute ago.
This is critical with after the event investigation into why deadlocks occurred with a view to resolving deadlocking to prevent it in the future.
The graph at the top displays the number of deadlocks at a point in time, this makes it easy to identify particularly bad times for deadlocks.
The grid in the middle of the screen shows the details of each individual deadlock occurrance.
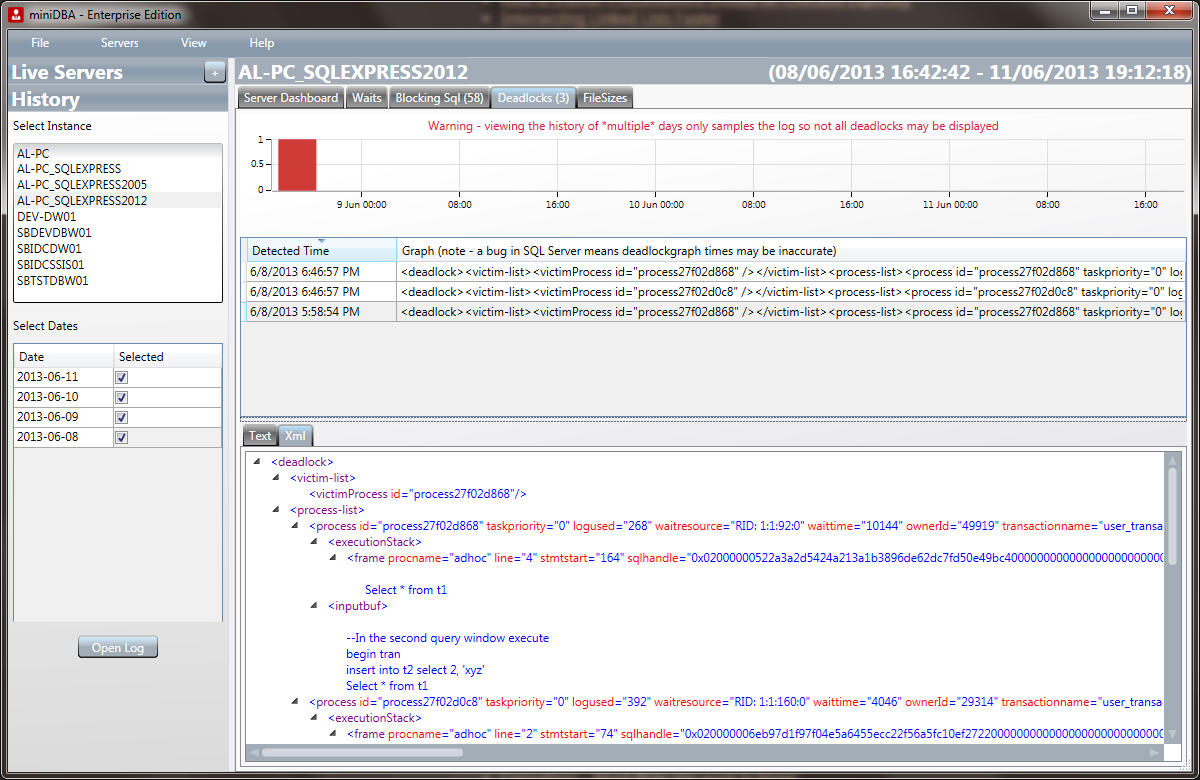
Clicking on a deadlock in the grid will display the deadlock graph at the bottom of the screen. Use the tabs to display either text or xml form.
All the information for the deadlock can be se in these graphs - which process/spid blocked which other spid when and for what resource.
Deadlocks can raise an alert in miniDBA Enterprise Edition in real time as they happen by enabling the deadlock alert.
Note:Deadlocks are only logged in miniDBA for SQL Server 2008 and later editions. Also pre release CTP versions have been seen to not log deadlocks reliabily so it is recommended you keep your installed version up to date with the latest service pack.
The main server dashboard in miniDBA displays real time deadlocks but the history viewer is where to find any deadlocks that occurred more than a minute ago.
This is critical with after the event investigation into why deadlocks occurred with a view to resolving deadlocking to prevent it in the future.
The graph at the top displays the number of deadlocks at a point in time, this makes it easy to identify particularly bad times for deadlocks.
The grid in the middle of the screen shows the details of each individual deadlock occurrance.
Clicking on a deadlock in the grid will display the deadlock graph at the bottom of the screen. Use the tabs to display either text or xml form.
All the information for the deadlock can be se in these graphs - which process/spid blocked which other spid when and for what resource.
Deadlocks can raise an alert in miniDBA Enterprise Edition in real time as they happen by enabling the deadlock alert.
Note:Deadlocks are only logged in miniDBA for SQL Server 2008 and later editions. Also pre release CTP versions have been seen to not log deadlocks reliabily so it is recommended you keep your installed version up to date with the latest service pack.