Server Dashboard
Activity
Live Query Statistics
Profiler
Server Memory
Waits
Error Log
Cpu
IO
SQL Queries
Healthcheck
Databases
Database
Tables/Partitions
Index Use
Index Fragmentation
Files
Locks
Memory
SQL Queries
Default Trace
Transaction Log
Healthcheck
Execution Plan View
Index Maintenance
Manual Index Analysis
Index Defragmentation Jobs
Alerts
Configuration
Slack Integration
Teams Integration
Custom SQL Alerts
Maintenance Windows
SQL Server Alerts List
Click the databases node to see the databases data grid. You can see storage and activity of every databases in the instance side by side. This gives a unique live view of all databases state and performance:
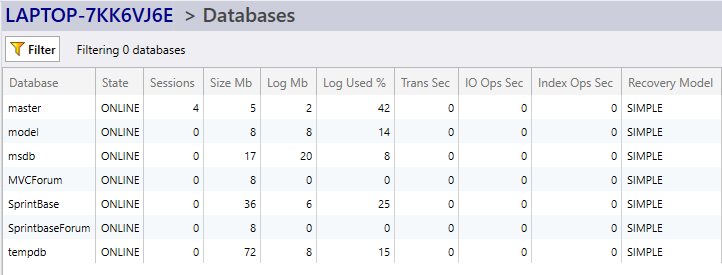
Fields
- Database: Db name.
- State: Database state - anything other than ONLINE will need attention.
- Sessions: Number of sessions that are currently in the database. This is a good indicator of how busy a database is.
- Size Mb: Data storage size on disk.
- Log Mb: Log storage size on disk.
- Log Used %: How full the transaction log is.
- Trans Sec: Transactions complete per second. A great indicator of how busy and how capable the database is in terms of processing data.
- IO Ops Sec: Input/Output operation per second. How many reads and writes are occuring to disk. Constant high values may mean indexes need tuning and/or storage disk hardware may need upgrading or the database having not sharing a disk.
- Index Ops Sec: Index operations per second.
- Recovery Model: Are any databases in simple mode when they should really be in full mode? Quickly scan all your databases here.