Server Dashboard
Activity
Live Query Statistics
Profiler
Server Memory
Waits
Error Log
Cpu
IO
SQL Queries
Healthcheck
Databases
Database
Tables/Partitions
Index Use
Index Fragmentation
Files
Locks
Memory
SQL Queries
Default Trace
Transaction Log
Healthcheck
Execution Plan View
Index Maintenance
Manual Index Analysis
Index Defragmentation Jobs
Alerts
Configuration
Slack Integration
Teams Integration
Custom SQL Alerts
Maintenance Windows
SQL Server Alerts List
SQL Server scheduler usage information is displayed in the 3 left hand graphs.
Active Workers - number of workers per scheduler that have an associated task, and are either running, runnable, or suspended
Runnable Tasks - number of workers per scheduler with tasks assigned to them, that are waiting to be scheduled on the runnable queue
Pending IO - Number of pending I/Os per scheduler that are waiting to be completed
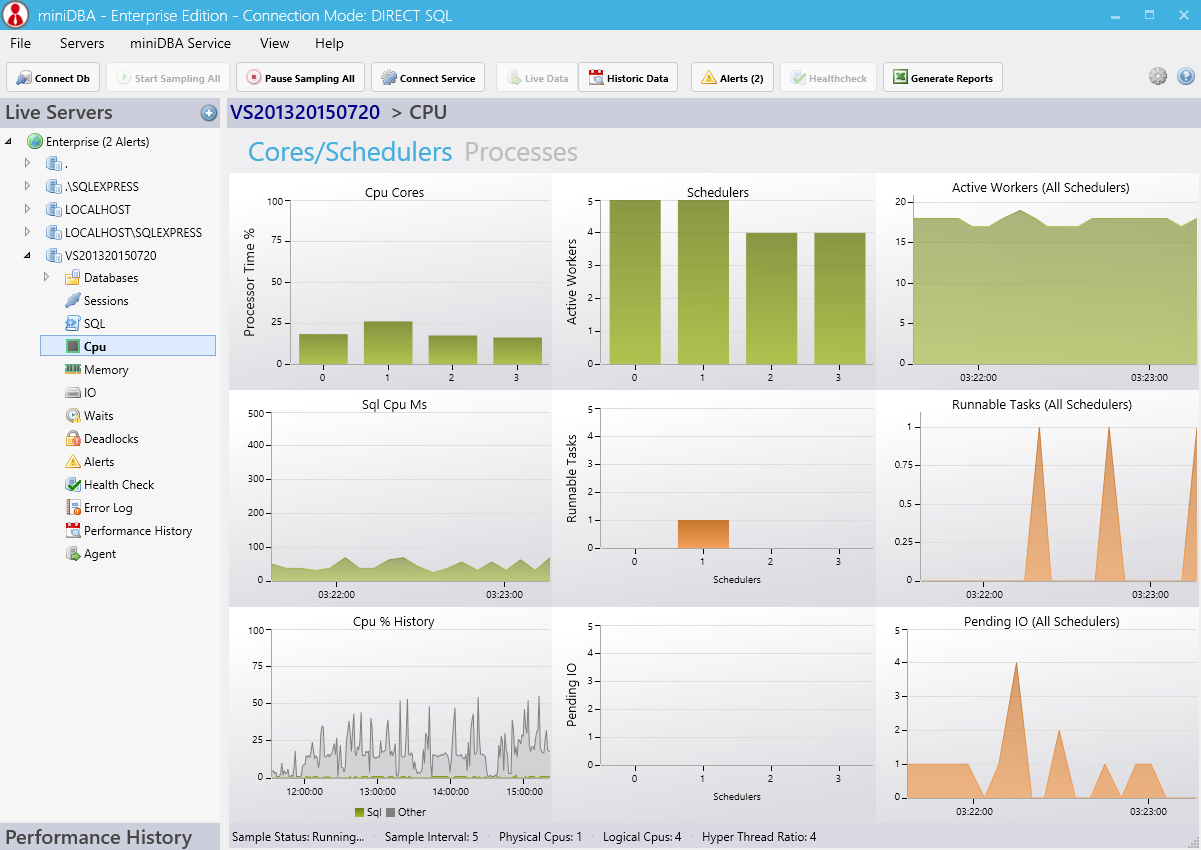
The core usage as well as total CPU usage and CPU history are displayed in the 3 right hand graphs.
To troubleshoot perfmon connectivity visit this link
Active Workers - number of workers per scheduler that have an associated task, and are either running, runnable, or suspended
Runnable Tasks - number of workers per scheduler with tasks assigned to them, that are waiting to be scheduled on the runnable queue
Pending IO - Number of pending I/Os per scheduler that are waiting to be completed
The core usage as well as total CPU usage and CPU history are displayed in the 3 right hand graphs.
Not Connecting To Performance Monitor
MiniDBA is dependent on conncting to the SQL Server's built in performance monitor counters. If the it says it is unable to connect then this screen will not have sample data available.To troubleshoot perfmon connectivity visit this link