Legacy Documentation
Desktop And Mini DBA Server
Legacy Documentation Home
alerts
analysisservicesalerts
analysisservicescpu
analysisservicesdashboard
analysisservicesdatabases
analysisservicesio
analysisservicessessions
azurealerts
azuredatabase
azuredatabasehealthcheck
azureindexes
azurelocks
azure security
azuresessions
azuresql
azuresqldatabase
azuresqldatabasedashboard
azuresqldatabases
azure sql server dashboard
azuretables
azurewaits
compare performance baseline
connections
cpu
custom sql server alerts
database
database query performance
databases
defaulttrace
dm exec query statistics xml
documentation
errorlog
files
gettingstarted
healthcheck database
healthcheck sql server
history active
history blocking
history data storage
history deadlocks
history files
history memory
history viewer
history waits
howtoperformancetuneazuresqldatabase
how to performance tune sql server
how to sql server performance tuning
how to sql server query tuning
indexes
Installation
io
License Support
locks
maintenance windows
options
performance history
security
server
servergettingstarted
Server Installation
server memory
serveroptions
serversecurity
servertroubleshooting
sql database memory
sql execution plan
sql extended event sessions
sql server activity
sql server alert configuration
sql server alerts
sql server database
sql server execution plan view
sql server index defrag jobs
sqlserverindexfragmentation
sql server index fragmentation
sql server index maintenance
sql server live query statistics
sqlserverqueryperformance
sql server query performance
sql server send slack alerts
sql server send teams alerts
sql server transaction log
sql server wait statistics
tables
tranlog
waits
webmonitorconfigure
webmonitorconnections
webmonitorcurrent
webmonitorcustom
webmonitorenterprise
webmonitorgettingstarted
webmonitorhistoric
webmonitorinstallation
webmonitorio
webmonitormemory
webmonitoroptions
webmonitoroverview
webmonitorsecurity
webmonitorwaits
wmi
Mini DBA provides tools for quickly seeing indexes and their fragmentation - a key factor in maximizing potential server performance
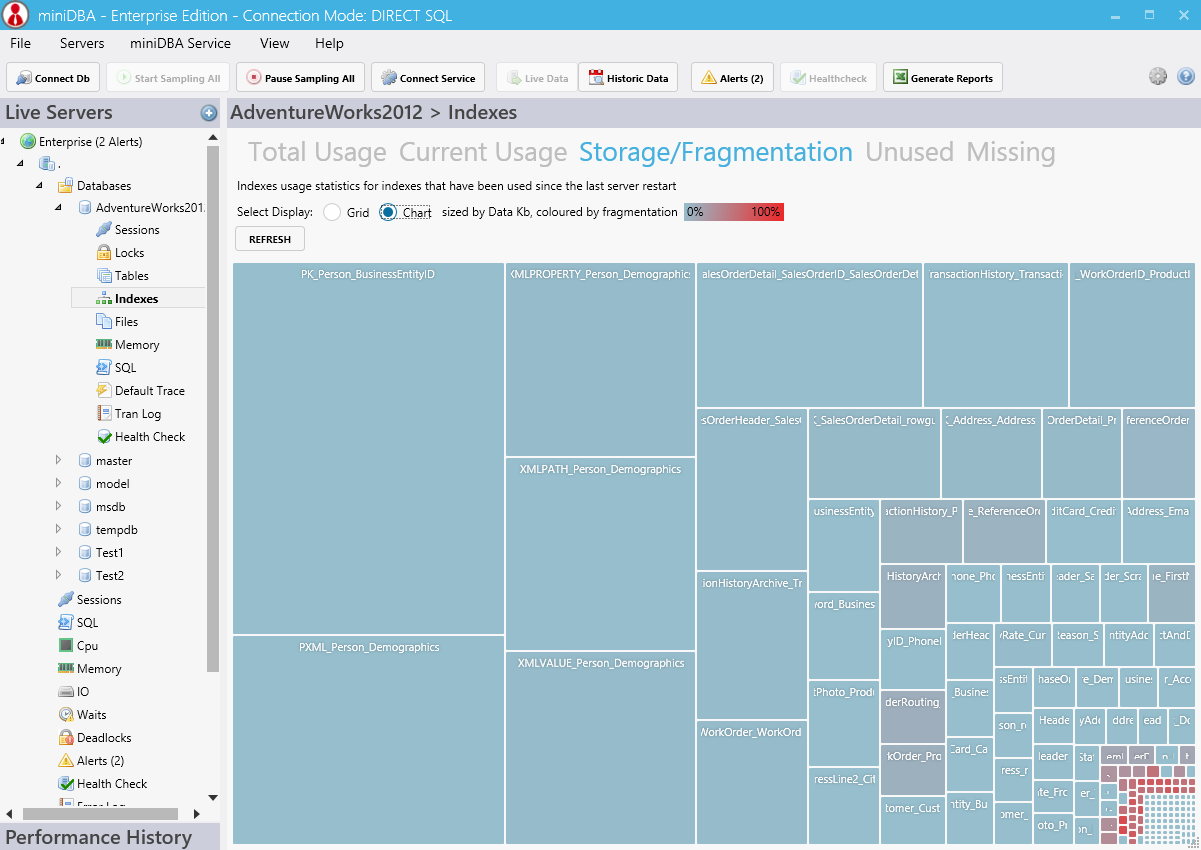
The storage details tab of the Indexes node, shows the index fragmentation heatmap visualization, which displays each index sized on its storage and coloured by fragmentation %. Using the combination of the size and the color of the index it is possible to start making a decision on how important the fragmentation is for that index.
The query used to populate this view is relatively heavy weight therefore a button to cancel the query is displayed while the query is executing.
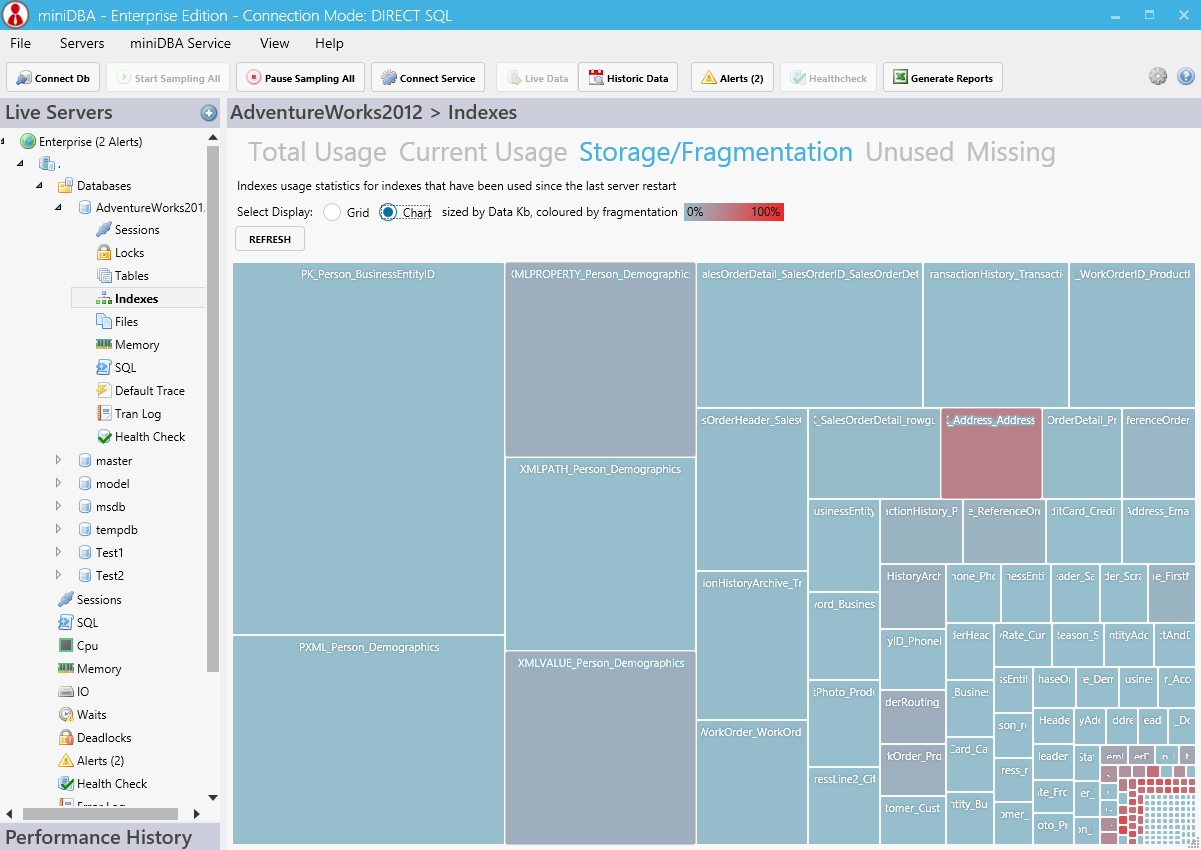
Larger tables with higher fragmentation require more immediate attention then just analysing frag percent alone - this visualization makes it easier to see the 2 factors combined.
Detailed information is given in tooltips for each index.
The radio button at the bottom of the screen allows you to list active or all indexes. Active is all the indexes that have been used since the last time the screen was refreshed. This is great for analysing particular batches to see what indexes are actually used by the query optimizer.
Aside from the table and index name the following columns are included:
The data Mini DBA gets from SQL Server is taken from the dm_db_index_physical_stats DMV - details here. The 'Mode' option used by the DMV is default - which gives simple level data to reduce the load on the server. If you need more detailed level index data then use that DMV directly in management studio.
Index statistics age is displayed which can be sorted by clicking column headers. On servers where auto-update stats is turned off there is the potential for statistics to become very out of date, leading to the query optimiser makes inefficient execution plans. These dangerously old statistics can be identified here.
The storage details tab of the Indexes node, shows the index fragmentation heatmap visualization, which displays each index sized on its storage and coloured by fragmentation %. Using the combination of the size and the color of the index it is possible to start making a decision on how important the fragmentation is for that index.
The query used to populate this view is relatively heavy weight therefore a button to cancel the query is displayed while the query is executing.
Larger tables with higher fragmentation require more immediate attention then just analysing frag percent alone - this visualization makes it easier to see the 2 factors combined.
Detailed information is given in tooltips for each index.
The radio button at the bottom of the screen allows you to list active or all indexes. Active is all the indexes that have been used since the last time the screen was refreshed. This is great for analysing particular batches to see what indexes are actually used by the query optimizer.
Fragmentation Details
When the storage/fragmentation grid is selected even more detailed information around partition level index fragmentation combined with the usage of each index can be seen. This combination of storage, fragmentation and usage enables you to have a comprehensive view of the state of the indexes and the relative importance of each one.
Aside from the table and index name the following columns are included:
- Part Num (partition number)
- Part Range Val (partition range value)
- Type (Index Type - clustered/nonclustered/heap)
- Avg Frag% (average fragmentation percent)
- Frag Count (fragmentated pages)
- Pages (total pages in index)
- Size Mb (index size in Mb)
- Depth (number of levels in the index)
- Level (level in the index - leaf level contains data for clustered index)
- Seeks (total seek operations performed on the index)
- Scans (total scan operations performed on the index)
- Lookups (total lookup operations performed on the index)
- Updates (total update operations performed on the index)
- Total Operations (total of all operations performed on the index)
- Last Operation (time of last operation)
- Stats Updated (last time statistics were updated)
- Stats Age (period of time since statistics were updated)
The data Mini DBA gets from SQL Server is taken from the dm_db_index_physical_stats DMV - details here. The 'Mode' option used by the DMV is default - which gives simple level data to reduce the load on the server. If you need more detailed level index data then use that DMV directly in management studio.
Index statistics age is displayed which can be sorted by clicking column headers. On servers where auto-update stats is turned off there is the potential for statistics to become very out of date, leading to the query optimiser makes inefficient execution plans. These dangerously old statistics can be identified here.