Legacy Documentation
Desktop And Mini DBA Server
Legacy Documentation Home
alerts
analysisservicesalerts
analysisservicescpu
analysisservicesdashboard
analysisservicesdatabases
analysisservicesio
analysisservicessessions
azurealerts
azuredatabase
azuredatabasehealthcheck
azureindexes
azurelocks
azure security
azuresessions
azuresql
azuresqldatabase
azuresqldatabasedashboard
azuresqldatabases
azure sql server dashboard
azuretables
azurewaits
compare performance baseline
connections
cpu
custom sql server alerts
database
database query performance
databases
defaulttrace
dm exec query statistics xml
documentation
errorlog
files
gettingstarted
healthcheck database
healthcheck sql server
history active
history blocking
history data storage
history deadlocks
history files
history memory
history viewer
history waits
howtoperformancetuneazuresqldatabase
how to performance tune sql server
how to sql server performance tuning
how to sql server query tuning
indexes
Installation
io
License Support
locks
maintenance windows
options
performance history
security
server
servergettingstarted
Server Installation
server memory
serveroptions
serversecurity
servertroubleshooting
sql database memory
sql execution plan
sql extended event sessions
sql server activity
sql server alert configuration
sql server alerts
sql server database
sql server execution plan view
sql server index defrag jobs
sqlserverindexfragmentation
sql server index fragmentation
sql server index maintenance
sql server live query statistics
sqlserverqueryperformance
sql server query performance
sql server send slack alerts
sql server send teams alerts
sql server transaction log
sql server wait statistics
tables
tranlog
waits
webmonitorconfigure
webmonitorconnections
webmonitorcurrent
webmonitorcustom
webmonitorenterprise
webmonitorgettingstarted
webmonitorhistoric
webmonitorinstallation
webmonitorio
webmonitormemory
webmonitoroptions
webmonitoroverview
webmonitorsecurity
webmonitorwaits
wmi
Mini DBA provides database level performance information for all queries in the query cache. This will change in SQL Server 2016 with the introduction of the Query Store - making all executed query statistics available. The execution statistics can be seen at both server and database level. Database level query execution statistics and execution plans are used when fixing a specific applications performance problem as opposed to a server wide search for offending T-SQL.
At the database level refreshing the execution data is quicker and easier to interpret as there is less data to read, especially on larger servers with more databases.
This screen in Mini DBA Desktop provides 4 custom views of the performance data:
By clicking on a row, the full T-SQL can be displayed in the query text box at the bottom of the screen.
The following screenshot shows the first (Slowest Queries) view.
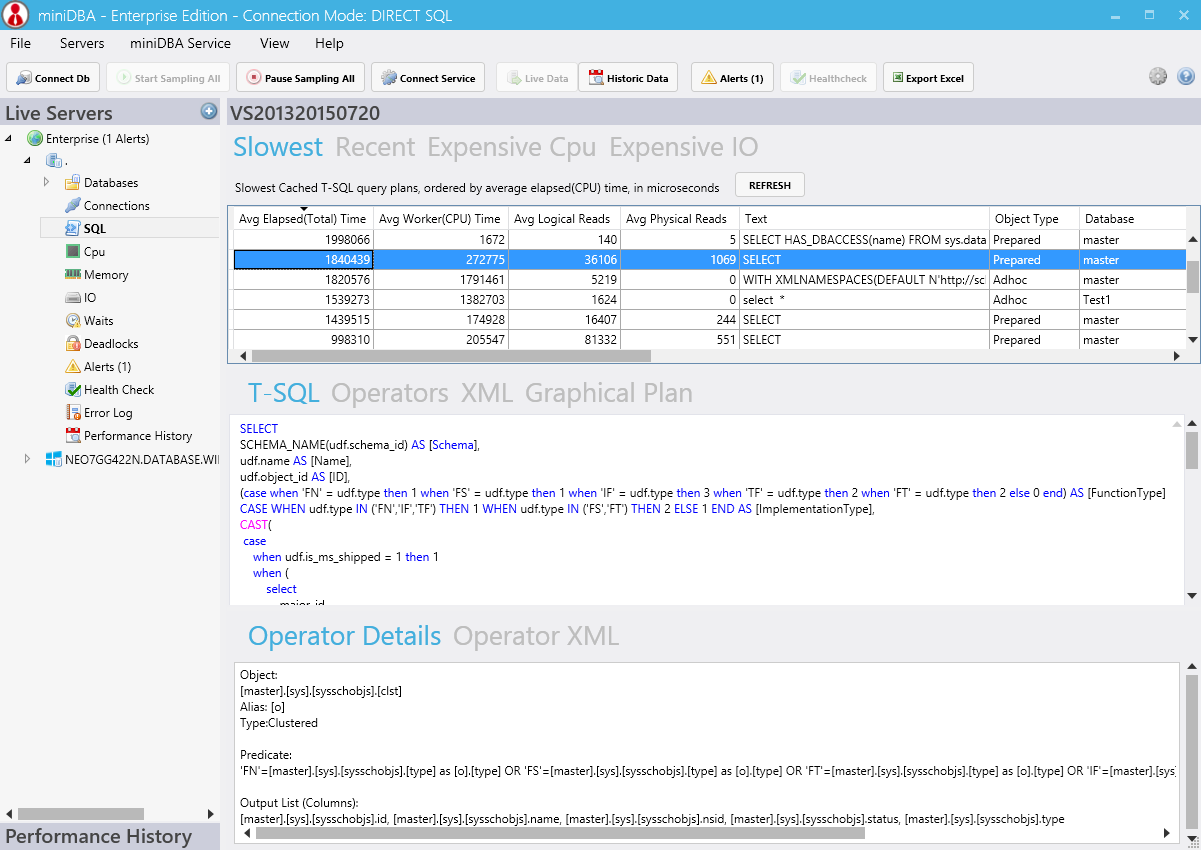
The following statistics are displayed in the grid (all times in milliseconds):
- Exe Count (Number of times the statement has been executed)
- Avg Worker Time (Average time the statement takes to execute)
- Avg Cpu Time (Average amount of time the statement uses the CPU)
- Avg Logical Reads (Average time the statement spends reading data)
- Avg Physical Reads (Average time the statement reads from storage)
- Total Worker Time (Time taken for all executions of the statement to execute)
- Total Physical Reads (Time taken for all executions of the statement to read from storage)
- Total Logical Reads (Time taken for all executions of the statement to read data)
Using this information it is simple to identify slow statements that may need performance tuning and also the nature of the issue, whether it is a CPU or an IO problem.
Total times can give a high level picture of the nature of the load on the server, whether it is used as much as others & scaling up CPU and/or IO would be helpful.
Clicking the button at the far right hand side of every queries data provides the t-sql required to see the statements execution plan in SQL Server Management Studio:
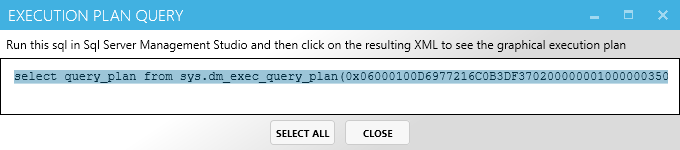
Combining the execution statistics in the data grid and the execution plans for each you can quickly find the sections of your statements that need changing.
At the database level refreshing the execution data is quicker and easier to interpret as there is less data to read, especially on larger servers with more databases.
This screen in Mini DBA Desktop provides 4 custom views of the performance data:
- Slowest Queries
- Recent Queries
- Expensive CPU
- expensive IO
By clicking on a row, the full T-SQL can be displayed in the query text box at the bottom of the screen.
The following screenshot shows the first (Slowest Queries) view.
The following statistics are displayed in the grid (all times in milliseconds):
- Exe Count (Number of times the statement has been executed)
- Avg Worker Time (Average time the statement takes to execute)
- Avg Cpu Time (Average amount of time the statement uses the CPU)
- Avg Logical Reads (Average time the statement spends reading data)
- Avg Physical Reads (Average time the statement reads from storage)
- Total Worker Time (Time taken for all executions of the statement to execute)
- Total Physical Reads (Time taken for all executions of the statement to read from storage)
- Total Logical Reads (Time taken for all executions of the statement to read data)
Using this information it is simple to identify slow statements that may need performance tuning and also the nature of the issue, whether it is a CPU or an IO problem.
Total times can give a high level picture of the nature of the load on the server, whether it is used as much as others & scaling up CPU and/or IO would be helpful.
Clicking the button at the far right hand side of every queries data provides the t-sql required to see the statements execution plan in SQL Server Management Studio:
Combining the execution statistics in the data grid and the execution plans for each you can quickly find the sections of your statements that need changing.