Legacy Documentation
Desktop And Mini DBA Server
Legacy Documentation Home
alerts
analysisservicesalerts
analysisservicescpu
analysisservicesdashboard
analysisservicesdatabases
analysisservicesio
analysisservicessessions
azurealerts
azuredatabase
azuredatabasehealthcheck
azureindexes
azurelocks
azure security
azuresessions
azuresql
azuresqldatabase
azuresqldatabasedashboard
azuresqldatabases
azure sql server dashboard
azuretables
azurewaits
compare performance baseline
connections
cpu
custom sql server alerts
database
database query performance
databases
defaulttrace
dm exec query statistics xml
documentation
errorlog
files
gettingstarted
healthcheck database
healthcheck sql server
history active
history blocking
history data storage
history deadlocks
history files
history memory
history viewer
history waits
howtoperformancetuneazuresqldatabase
how to performance tune sql server
how to sql server performance tuning
how to sql server query tuning
indexes
Installation
io
License Support
locks
maintenance windows
options
performance history
security
server
servergettingstarted
Server Installation
server memory
serveroptions
serversecurity
servertroubleshooting
sql database memory
sql execution plan
sql extended event sessions
sql server activity
sql server alert configuration
sql server alerts
sql server database
sql server execution plan view
sql server index defrag jobs
sqlserverindexfragmentation
sql server index fragmentation
sql server index maintenance
sql server live query statistics
sqlserverqueryperformance
sql server query performance
sql server send slack alerts
sql server send teams alerts
sql server transaction log
sql server wait statistics
tables
tranlog
waits
webmonitorconfigure
webmonitorconnections
webmonitorcurrent
webmonitorcustom
webmonitorenterprise
webmonitorgettingstarted
webmonitorhistoric
webmonitorinstallation
webmonitorio
webmonitormemory
webmonitoroptions
webmonitoroverview
webmonitorsecurity
webmonitorwaits
wmi
The waits tab of the history viewer display waits over the course of the selected timeframe.
The top half of the screen displays a graph and grid showing wait totals for every minute. The lower half of the screen shows a detailed break down of what waits were occuring at each minute.
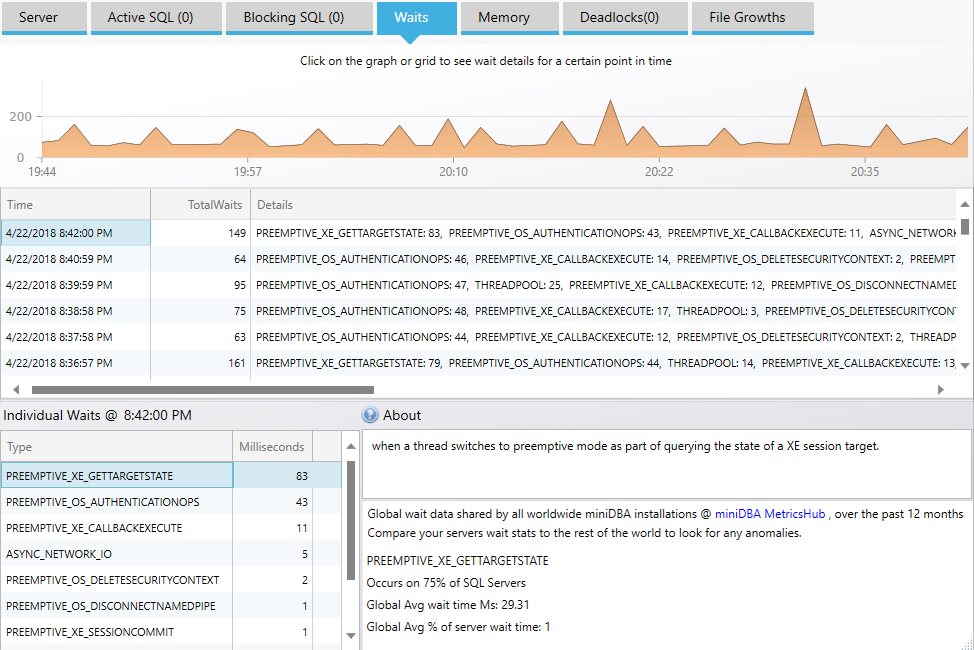
Clicking on the graph at a point of interest will highlight that particular sampled minute in the data grid below. The grid shows each wait type happening then, starting with the longest waits on the left.
Each grid row is clickable and will displayed a more detailed break down in the lower half of the screen. The grid in the bottom left displays an ordered list of wait types at the given minute. Clicking on a wait will show the wait type details in the bottom right of the screen.
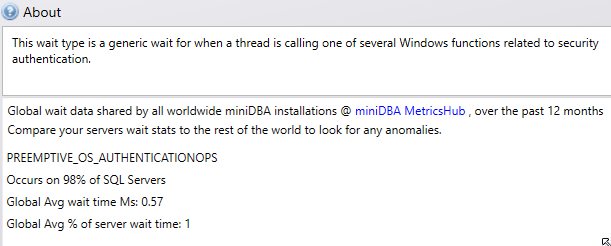
The "About" box will show you a description of the wait type. The lower section shows global wait statistics for the wait type across all sql servers sampled by Mini DBA. This enables you to compare your sql server against the rest of the world and help give an indication if this wait type is something to be concerned about.
The top half of the screen displays a graph and grid showing wait totals for every minute. The lower half of the screen shows a detailed break down of what waits were occuring at each minute.
Clicking on the graph at a point of interest will highlight that particular sampled minute in the data grid below. The grid shows each wait type happening then, starting with the longest waits on the left.
Each grid row is clickable and will displayed a more detailed break down in the lower half of the screen. The grid in the bottom left displays an ordered list of wait types at the given minute. Clicking on a wait will show the wait type details in the bottom right of the screen.
The "About" box will show you a description of the wait type. The lower section shows global wait statistics for the wait type across all sql servers sampled by Mini DBA. This enables you to compare your sql server against the rest of the world and help give an indication if this wait type is something to be concerned about.