Legacy Documentation
Desktop And Mini DBA Server
Legacy Documentation Home
alerts
analysisservicesalerts
analysisservicescpu
analysisservicesdashboard
analysisservicesdatabases
analysisservicesio
analysisservicessessions
azurealerts
azuredatabase
azuredatabasehealthcheck
azureindexes
azurelocks
azure security
azuresessions
azuresql
azuresqldatabase
azuresqldatabasedashboard
azuresqldatabases
azure sql server dashboard
azuretables
azurewaits
compare performance baseline
connections
cpu
custom sql server alerts
database
database query performance
databases
defaulttrace
dm exec query statistics xml
documentation
errorlog
files
gettingstarted
healthcheck database
healthcheck sql server
history active
history blocking
history data storage
history deadlocks
history files
history memory
history viewer
history waits
howtoperformancetuneazuresqldatabase
how to performance tune sql server
how to sql server performance tuning
how to sql server query tuning
indexes
Installation
io
License Support
locks
maintenance windows
options
performance history
security
server
servergettingstarted
Server Installation
server memory
serveroptions
serversecurity
servertroubleshooting
sql database memory
sql execution plan
sql extended event sessions
sql server activity
sql server alert configuration
sql server alerts
sql server database
sql server execution plan view
sql server index defrag jobs
sqlserverindexfragmentation
sql server index fragmentation
sql server index maintenance
sql server live query statistics
sqlserverqueryperformance
sql server query performance
sql server send slack alerts
sql server send teams alerts
sql server transaction log
sql server wait statistics
tables
tranlog
waits
webmonitorconfigure
webmonitorconnections
webmonitorcurrent
webmonitorcustom
webmonitorenterprise
webmonitorgettingstarted
webmonitorhistoric
webmonitorinstallation
webmonitorio
webmonitormemory
webmonitoroptions
webmonitoroverview
webmonitorsecurity
webmonitorwaits
wmi
Analysis Services Dashboard
The SSAS server dashboard contains several SSAS specific graphs as well as a collapsable properties pane on the right hand side.
The property pane has detailed tooltips for each server property to help user understand what they mean. Where relevent they also contain links to helpful MSDN articles
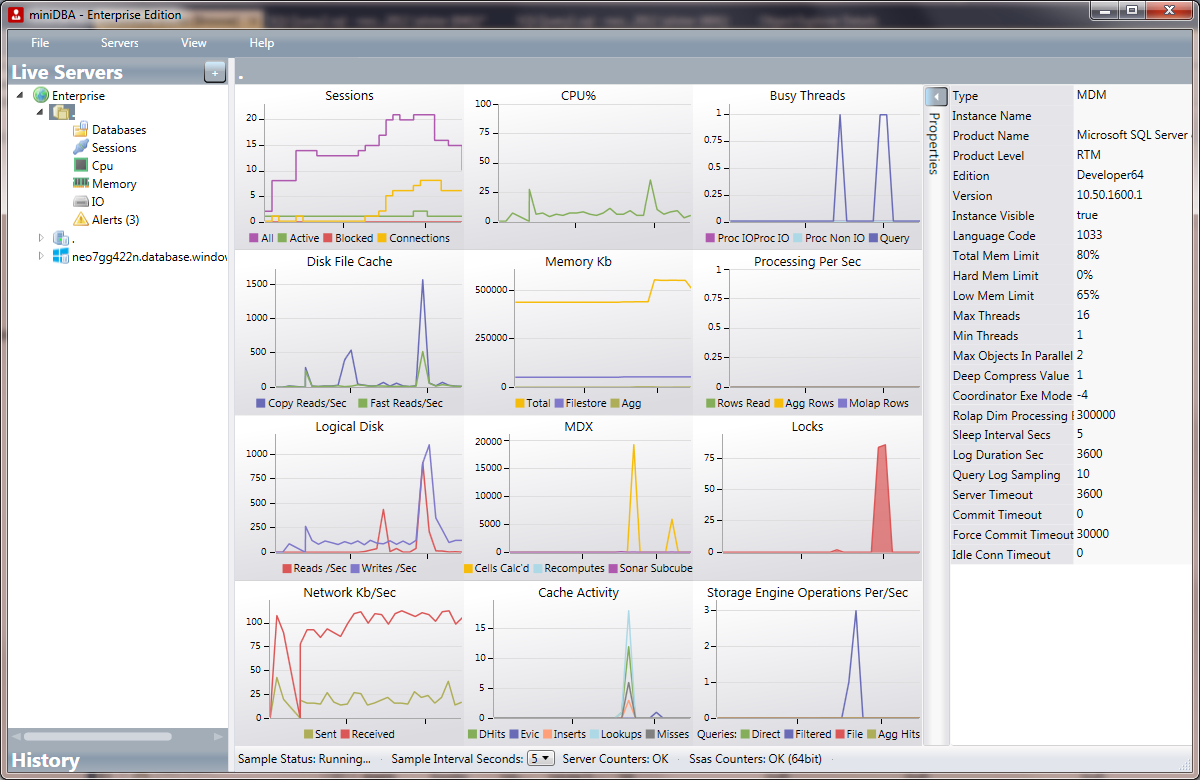
The following are Analysis Services specific database properties shown on the SSAS dashboard:
- - Sessions
- - Cpu Usage
- - Thread activity - queries & processing
- - Disk File Cache
- - Memory consumption
- - Processing activity - aggregations, rows & MOLAP activity
- - Logical Disk
- - MDX - cells calculated, recomputes & sonar subcubes
- - Locks
- - Network IO
- - Cache activity - hits, evictions, inserts & lookups
Tabular Mode
Tabular mode is supported by Mini DBA as well as multi-dimensional.Mini DBA automatically detects the server type and changes what is displayed on the dashboard accordingly.
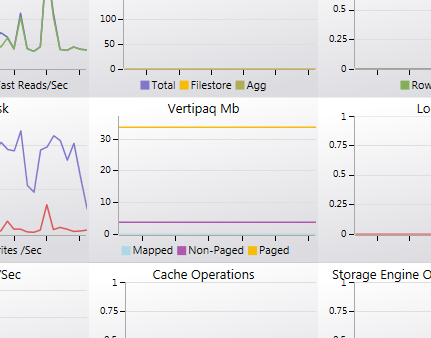
As seen below the MDX chart seen in the previous multi-dimensional screenshot is replaced by a Vertipaq chart. It displays the amount of memory being used by the Vertipaq engines for:
- - Mapped Mb
- - Paged Mb
- - Non Paged Mb