Investigate in the Console
Move from estate health to the affected server, database, session, query, alert or plan while preserving the context of the incident.
Mini DBA continuously collects the workload and resource evidence needed to diagnose slow SQL Server applications without waiting for somebody to reproduce the problem.
Performance incidents cross CPU, memory, I/O, waits, sessions and queries. The Console brings those layers together and the Engine keeps collecting when no user is signed in.
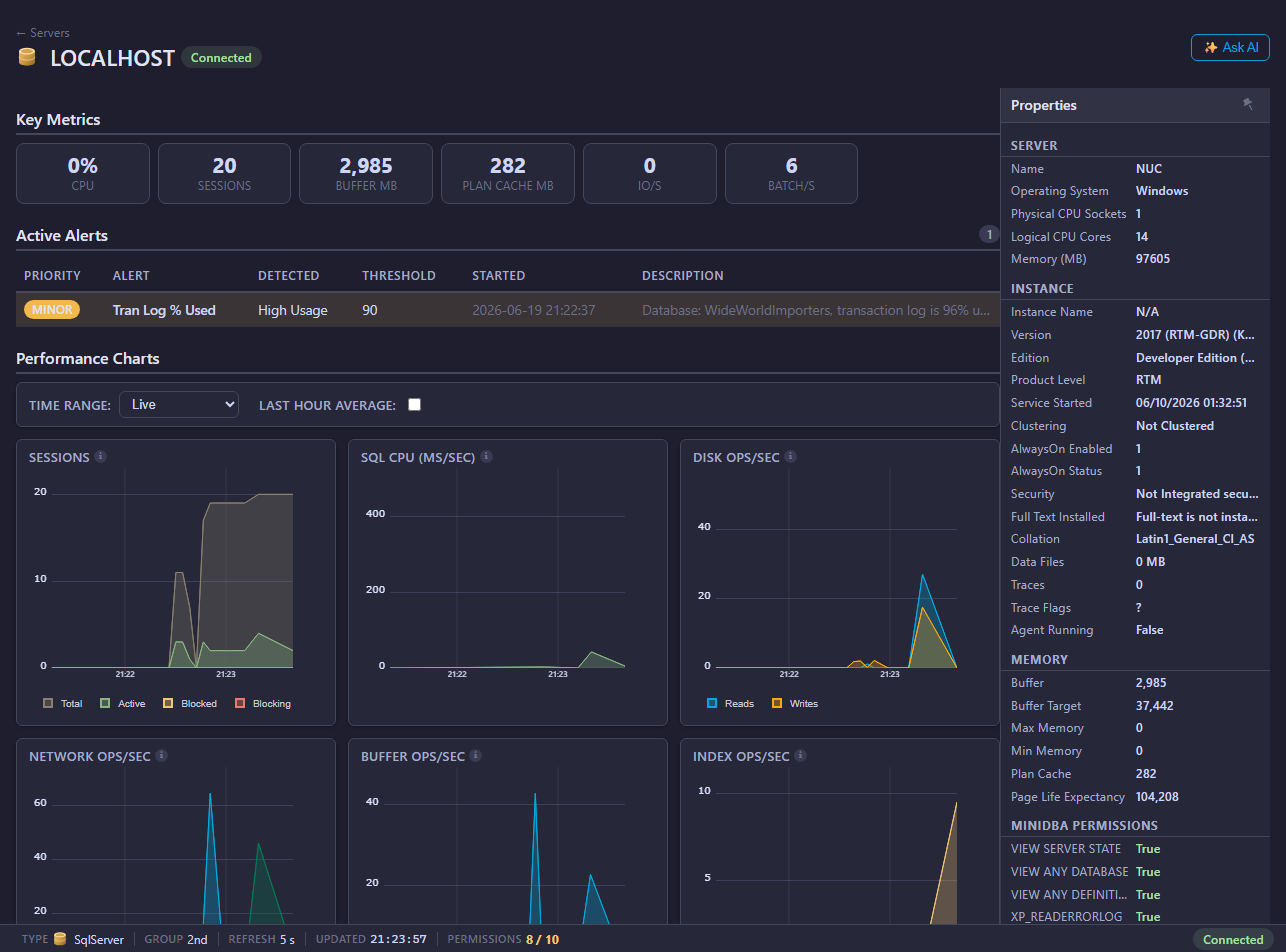
The Mini DBA Engine collects monitoring data and evaluates alerts continuously. Teams use the browser Console to investigate live and historical evidence through the current Console and Engine architecture.
Move from estate health to the affected server, database, session, query, alert or plan while preserving the context of the incident.
Optionally send relevant metrics, sessions, alerts and page detail for guided analysis of the problem in front of you.
Connect an approved MCP-compatible AI client to ask questions across servers, history or managed customer estates.
Install Mini DBA on Windows, host it on a suitable Linux virtual machine, or use the supported container deployment. One Engine suits most environments; additional Engines are optional for advanced multi-site or network-separated estates.
Review installation options or see all database monitoring features.
Use a problem-led workflow across SQL Server, PostgreSQL, MySQL, MariaDB, Oracle and Azure SQL.
Find the lead blocker and understand every waiting session.
Investigate blocking →Preserve participants, statements and resources after the event.
Analyse deadlocks →Prioritise expensive workload and inspect execution plans.
Analyse queries →Reconstruct incidents after the live symptoms have gone.
Explore history →Install Mini DBA on Windows, a suitable Linux VM or a supported container platform, connect an Engine and start collecting the evidence behind performance incidents.