Sql Server Performance Dashboard
Overview
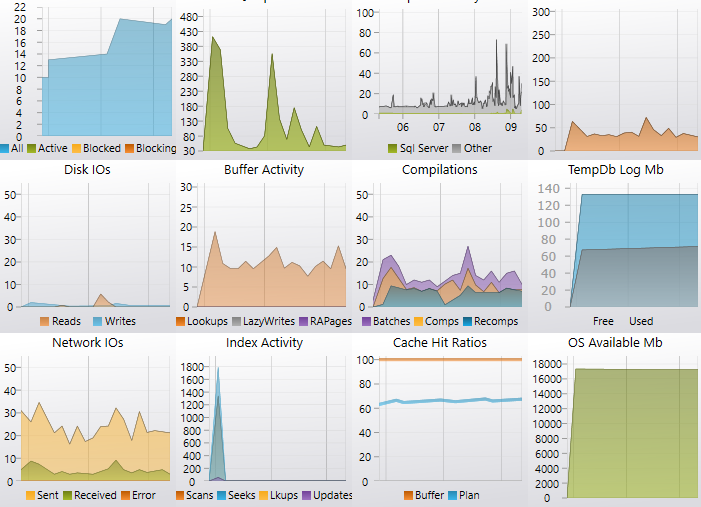
The SQL Server Performance Dashboard is one of many screens that make up the miniDBA Desktop product. Below you can see the level of detail and functionality this particular dashboard has.
To see other dashbaords in the application visit our screenshots or documentation
Clicking on a server or instance in the server explorer will display the sql server dashboard.
Right clicking the server node will give you the options to stop/start sampling the server, display the settings for the server or disconnect the server.
When a server is disconnected any settings you have set such as connection, logging, triggers and alerts, will be lost. When you reconnect to that server default settings will be used.
Activity counters such as Disk IO & Buffer Activity are the 'Per Second' values, therefore you may see values of less than 1 depending on you sample interval.
The server dashboard displays current activity in graph form and also properties on the right of the screen. Click the property name labels to access relevent online documentation for each property.
"Active" metric is the number of user sessions in a transaction or actively performing an operation
"Blocked" is the number of sessions that are causing other sessions to be blocked
"Blocking" is the number of sessions that are being blocking from executing by blocking sessions
This metric can be useful in identifying unexpected cpu useage
"SQL Server" metric is the amount of CPU *this* instance of SQL Server has used. If other instances are running on this server they are not included in the metric.
"Other" metric shows CPU use by all other processes running on the server.
Look for not only very high cpu useage by SQL Server (possible innefficient indexes/query plans), also other processes using a lot of CPU means they may be stealing from this instance.
When performance tuning, increasing transaction sec is often a key metric that is to be increased.
A high number of reads may indicate memory pressure
Generally high IO useage may require each disk to be checked in the IO dashboard to see if there is contention between files on a single disk.
Look for a high number of error packets as it could mean a misconfigured network
Lookups are logical reads of data required to satisfy the query which may spill to disk
Lazy Writes are the number of times per second SQL Server relocates dirty pages from buffer pool (memory) to disk. If it is above 20 then memory pressure may be present.
Read Ahead Pages are physically read from the disk as an internal performance enhancement.
Batches per second shows the number of batches sent to SQL Server.
Compilations per second are the number of query plans that get compiled.
A batch may contain many statements therefore compilations per second *may* exceed batches sec.
It is recommended compilations per second be under 10% of batches per second.
Re-compilations per second are existing cached query plans that get compiled again.
An example reason for a plan being recompiled is that new statistics exist for an included index so the old plan is disgarded.
It is recommended re-compilations per second be under 10% of compilations per second.
TempDb log useage being > 95% usually causes a performance bottleneck if the log can't grow any more.
Look for high useage with the total size not growing. A long running open transaction may cause the log to not be able to be backep up and grow.
"Seeks" are preferred over scans as only necessary rows are touched which will probably be more efficient.
"Lookups" are bookmark lookups (non clustered index needs to lookup data in the clustered index) by user queries. It may be quicker to add necessary columns as included columns to the non clustered index.
"Updates" are insert, update, or delete operations on tables or views
Generally lower percentages may indicate a lot of (slow) physical disk reads, which extra memory may alleviate.
Plan hit ration shows % of batches that have existing plans in the cache.
The higher the better as queries with existing plans will execute faster than those without.
Ideally on a server dedicated to SQL server this will be fairly low and SQL will be using the majority of the memory.
Bulk Copy operations will read large amounts of data quickly from a drive.
Backup/Restore may slow performance in other databases on shared storage.
Shrinks may also reduce available IO throughput on a drive.
A deadlock is when 2 processes fighting for a resource lock.
Index design can help reduce deadlocks.
Free memory is memory committed for SQL Server but currently not actually used.
Database memory is being used by databases to store their data.
Stolen memory is taken from the buffer pool to use for miscellaneous server purposes (including procedure cache).
Consists of buffer use plus linked servers, xp's, private windows allocations etc.
SQL Server may use shared resources in the operating system, meaning overall useage may be slightly larger when including these shared components.
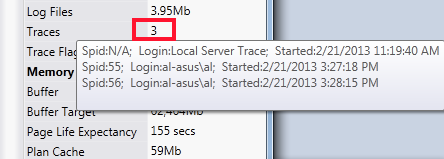
Traces and Trace flags property values have dynamic tooltips that will give you summary trace info:
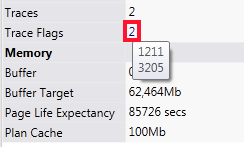
...and also what trace flags are enabled:
The various options will take you to the performance history screen and load the data for the time option you select.
To see other dashbaords in the application visit our screenshots or documentation
Clicking on a server or instance in the server explorer will display the sql server dashboard.
Right clicking the server node will give you the options to stop/start sampling the server, display the settings for the server or disconnect the server.
When a server is disconnected any settings you have set such as connection, logging, triggers and alerts, will be lost. When you reconnect to that server default settings will be used.
Activity counters such as Disk IO & Buffer Activity are the 'Per Second' values, therefore you may see values of less than 1 depending on you sample interval.
The server dashboard displays current activity in graph form and also properties on the right of the screen. Click the property name labels to access relevent online documentation for each property.
Charts
Mouse over the graphs to see the current counter values and tooltips.Sessions
"All" metric is the total number of user sessions"Active" metric is the number of user sessions in a transaction or actively performing an operation
"Blocked" is the number of sessions that are causing other sessions to be blocked
"Blocking" is the number of sessions that are being blocking from executing by blocking sessions
Sql Cpu Milliseconds
Milliseconds of CPU that SQL Server is using per secondThis metric can be useful in identifying unexpected cpu useage
CPU % History
The last 4 hours of CPU activity across all cores"SQL Server" metric is the amount of CPU *this* instance of SQL Server has used. If other instances are running on this server they are not included in the metric.
"Other" metric shows CPU use by all other processes running on the server.
Look for not only very high cpu useage by SQL Server (possible innefficient indexes/query plans), also other processes using a lot of CPU means they may be stealing from this instance.
Transactions Per Second
Useful as a baseline on busy servers.When performance tuning, increasing transaction sec is often a key metric that is to be increased.
Disk IOs Per Second
Physical disk operations per second on all drives for the instance.A high number of reads may indicate memory pressure
Generally high IO useage may require each disk to be checked in the IO dashboard to see if there is contention between files on a single disk.
Network IOs Per Second
IOs (input/output packets) travelling through the server's network cardLook for a high number of error packets as it could mean a misconfigured network
Buffer Page Activity
The metrics display activity within the SQL Server memory bufferLookups are logical reads of data required to satisfy the query which may spill to disk
Lazy Writes are the number of times per second SQL Server relocates dirty pages from buffer pool (memory) to disk. If it is above 20 then memory pressure may be present.
Read Ahead Pages are physically read from the disk as an internal performance enhancement.
Compilations Per Second
Every batch that is executed in the query engine can be eith compiled or recompiled.Batches per second shows the number of batches sent to SQL Server.
Compilations per second are the number of query plans that get compiled.
A batch may contain many statements therefore compilations per second *may* exceed batches sec.
It is recommended compilations per second be under 10% of batches per second.
Re-compilations per second are existing cached query plans that get compiled again.
An example reason for a plan being recompiled is that new statistics exist for an included index so the old plan is disgarded.
It is recommended re-compilations per second be under 10% of compilations per second.
TempDb Log Status
All databases in the instance rely on a single TempDb.TempDb log useage being > 95% usually causes a performance bottleneck if the log can't grow any more.
Look for high useage with the total size not growing. A long running open transaction may cause the log to not be able to be backep up and grow.
Index Activity Per Second
"Scans" are mostly poor performing on any large index as they look at every row."Seeks" are preferred over scans as only necessary rows are touched which will probably be more efficient.
"Lookups" are bookmark lookups (non clustered index needs to lookup data in the clustered index) by user queries. It may be quicker to add necessary columns as included columns to the non clustered index.
"Updates" are insert, update, or delete operations on tables or views
Cache Hit Ratios
Buffer Cache ratio shows the % of pages found in the buffer pool vs on disk.Generally lower percentages may indicate a lot of (slow) physical disk reads, which extra memory may alleviate.
Plan hit ration shows % of batches that have existing plans in the cache.
The higher the better as queries with existing plans will execute faster than those without.
OS Available Mb
The MB of memory (RAM) available to the operating system. Other processes on the server will reduce this.Ideally on a server dedicated to SQL server this will be fairly low and SQL will be using the majority of the memory.
Data Movement
This shows types of intense IO operation that may reduce performance, server wide.Bulk Copy operations will read large amounts of data quickly from a drive.
Backup/Restore may slow performance in other databases on shared storage.
Shrinks may also reduce available IO throughput on a drive.
Deadlocks
Displays deadlocks per second.A deadlock is when 2 processes fighting for a resource lock.
Index design can help reduce deadlocks.
Buffer Size
How the buffer cache is being used.Free memory is memory committed for SQL Server but currently not actually used.
Database memory is being used by databases to store their data.
Stolen memory is taken from the buffer pool to use for miscellaneous server purposes (including procedure cache).
Instance Memory Used Mb
The amount of private memory being used by this instance of SQL Server.Consists of buffer use plus linked servers, xp's, private windows allocations etc.
SQL Server may use shared resources in the operating system, meaning overall useage may be slightly larger when including these shared components.
Properties Pane
Key server properties are displayed here, which all have links to relevant Microsoft documentation in the properties' tooltip.Traces and Trace flags property values have dynamic tooltips that will give you summary trace info:
...and also what trace flags are enabled:
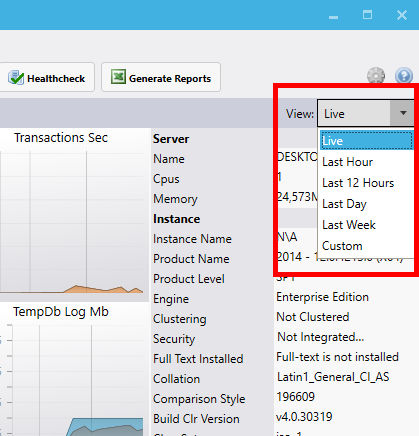
Time View Dropdown
At the top right of the dashboard the time view dropdown gives you a shortcut to access historic performance data that miniDBA has saved.
The various options will take you to the performance history screen and load the data for the time option you select.