Sql Server Live Query Statistics
Starting with SQL Server 2014 SP2 & 2016SP1, query execution statistics are available as queries are running for all requests not just your own. When trace flag 7412 is enabled miniDBA uses the new lightweight query execution statistics profiling infrastructure to retrieve live execution plan details. This lets you see all live plan operators plus all the built in SQL Server metrics miniDBA monitors such as waits, IO, CPU, memory and more. Previous versions of SQL Server could tell you actual execution plan details about a query you had just run but that is very different from being able to see the live, changing execution plan of yours and other users queries.
This enhances your ability to trouble shoot long running queries, both your own and all other users on the instance.
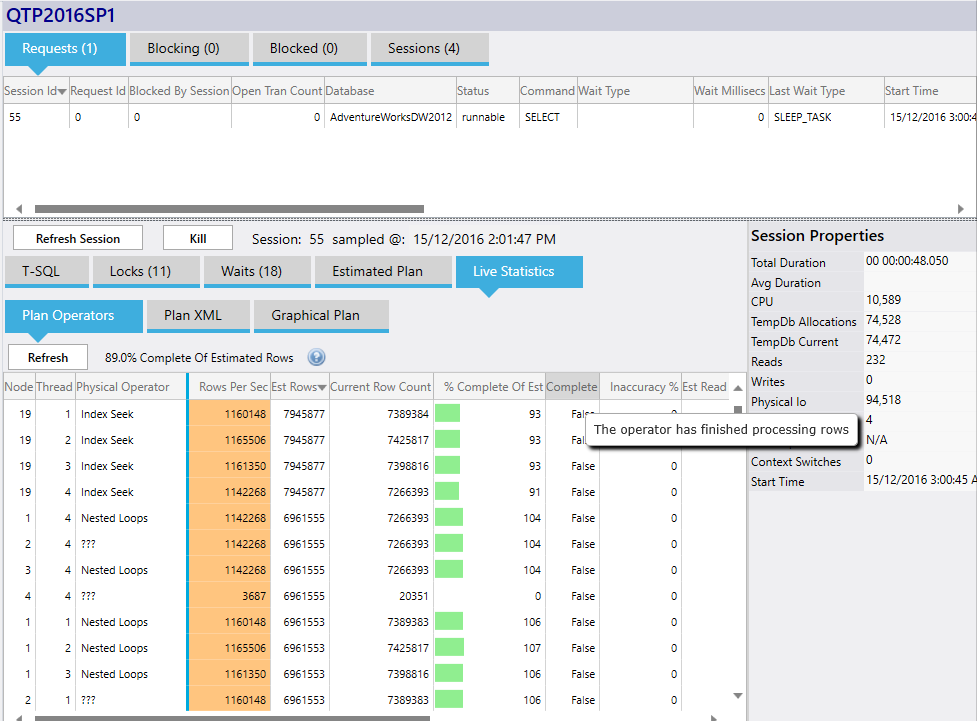
In miniDBA Desktop, after clicking on a request in the top datagrid of the Activity dashboard and then the "Live Statistics" tab underneath, you will see the requests execution plan.
This is shown as 3 tabs:
Plan Operators
Each operator of the execution plan is shown as a row and the data updates when you click the Refresh button. If the request has complete nothing will be displayed when Refresh is clicked.Queries that are taking a long time to run will stay here as you click the Refresh button and observer changes in the operators.
Columns and their uses:
- Node - Execution plan node.
- Thread - If multi-threading is being used there will be several of these per node.
- Rows per sec - Current rows being read/written. Order by this column to see where the current activity is in the execution plan. Colored orange when active.
- Estimated rows - The estimated execution plans guess as to how many rows will need to be processed based an the statistics for the indexes being used.
- Current Row Count - Shows actual rows that have been processed so far.
- % Complete of Estimated - Shows actuals rows processed as a % of estimated so far.
- Complete - has the operator finished yet?
- Inaccuracy % - When complete will show how far out the estimated number of rows to be processed for this operator is compared to actualy.
miniDBA keeps accurately reporting percentages even if they are over 100 until the request is complete.
Plan XML
Text version of the execution plan. You can save this text somewhere to study in detail if you need to.Graphical Plan
The button to display the plan launches and executable program on your computer that is designated to hand .sqlplan files.SQL Server Management Studio will launch if installed and use it's graphical display to show you the plan.