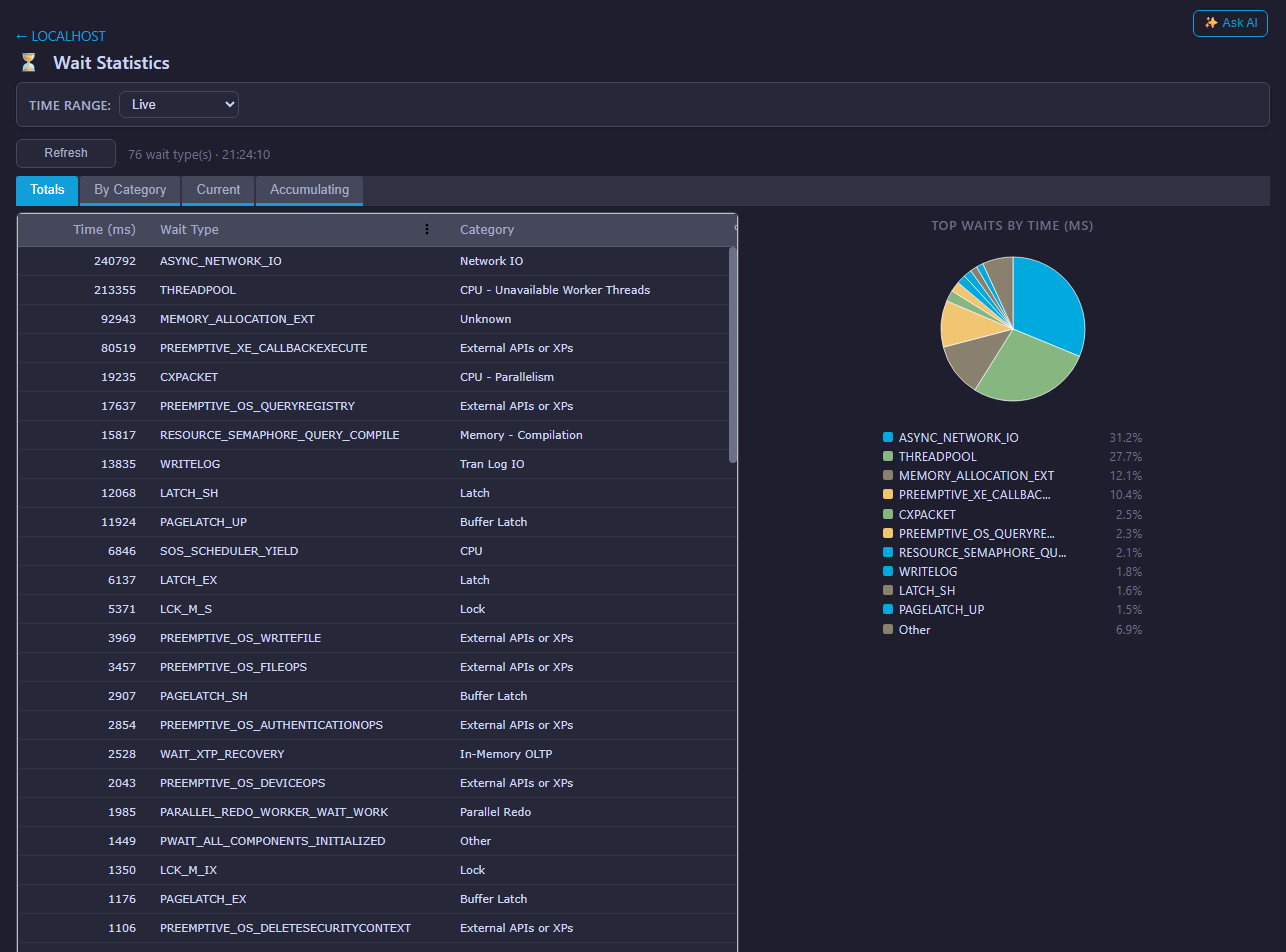
The SQL Server Waits page shows wait statistics that help explain where SQL Server workload is spending time. Wait analysis is a core performance troubleshooting workflow.
What waits can indicate
- Storage pressure.
- CPU scheduler pressure.
- Blocking or locking.
- Memory grant pressure.
- Network waits.
- Parallelism waits.
- Application or client behavior.
Workflow
- Open Waits for the SQL Server.
- Identify the dominant wait categories.
- Compare with Activity for live sessions.
- Review Cached SQL and Query Store for matching expensive queries.
- Check resource pages such as CPU, Memory, Drives, and Files.
Live and historical wait data
The SQL Server Waits page includes the Mini DBA Time Range selector. Use Live for current wait changes, or switch to Last Hour, Last 12 Hours, Last Day, Last Week, or Custom to review historical wait rows and charts. Mini DBA loads and caches the selected historical waits dataset for the current console session and server context, so you can compare the loaded wait period with other evidence without repeatedly waiting for the same range to reload. Use Back to Live to resume live updates, then choose another historical range when you need a different incident window.
How to use waits safely
Waits are clues, not final diagnoses. A high wait type tells you where SQL Server workers spent time, but you still need supporting evidence. For example, WRITELOG waits can point to transaction log I/O, transaction design, or commit frequency. LCK waits can point to blocking, long transactions, or application concurrency. CX waits can point to parallelism, but may also be a symptom of expensive queries.
Use waits to choose the next page. If waits look like locks, go to Activity and Deadlocks. If waits look like storage, review Files and Drives. If waits look like CPU or memory grants, review CPU, Memory, and Queries.
SQL Server waits FAQ
What is a good SQL Server wait?
There is no universal good wait. Every SQL Server has waits. Focus on waits that dominate the workload, changed recently, or match user symptoms.
Should I clear wait stats?
Do not clear wait stats on production just to make a monitoring page look clean. Use interval deltas, time windows, and supporting pages instead.
Can waits identify the exact query?
Waits identify bottleneck categories. Use Activity, Cached SQL, and Query Store to connect waits to specific sessions and queries.