FASTER TROUBLE SHOOTING
Increase the speed of your servers and applications
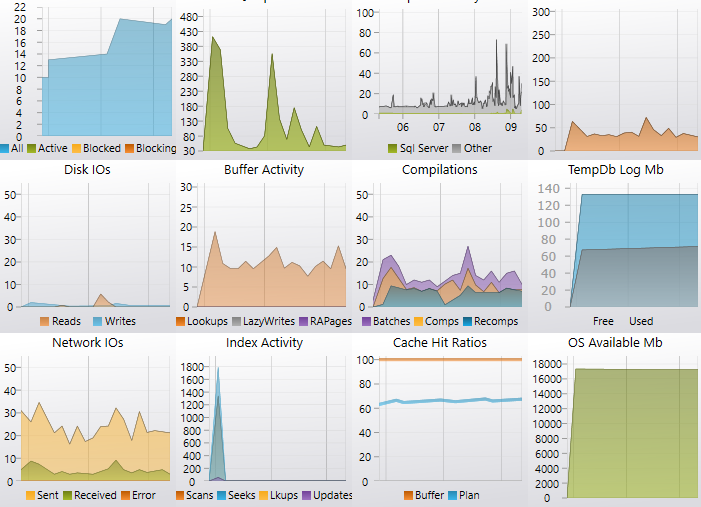
Enterprise View
Entire SQL Server & Azure SQL Database estate status displayed in 1 screen allows you to see where the pain is straight away.
All current issues displayed in 1 place allows you to dig straight into any issues by simply drilling down through the app.
No Code
Save time by not writing any T-SQL to find your issues. Don't spend time remembering the syntax of DBCC commands or digging out the diagnostics query from the back of your toolbox.
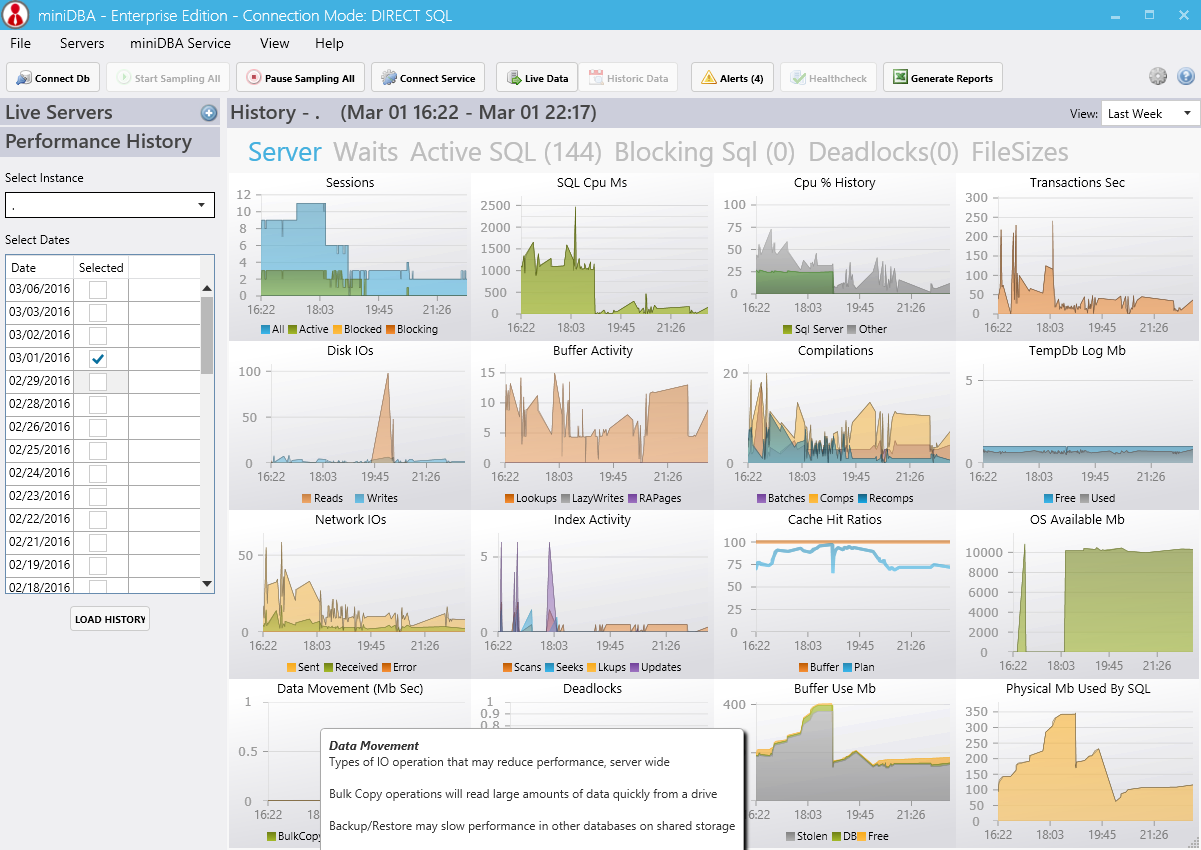
Analyse History
- Sampled data is stored and can be viewed in the History Viewer: performancecounters, waits, deadlocks & Sql are all available for performance analysis
- Review historic saved data to plan scaling & increase the lifespan of your hardware
- Monitor data is written to an internal database - no need to setup & license a logging database
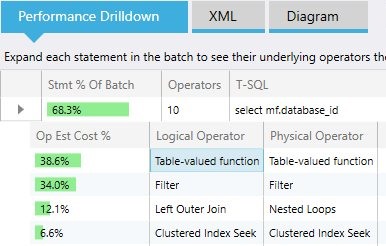
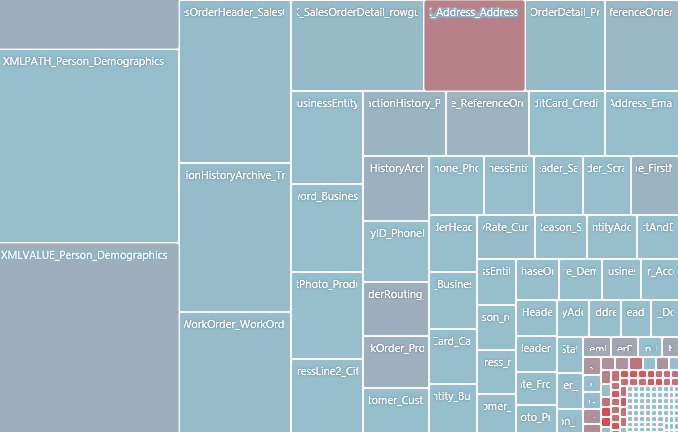
Long Running & Blocking Queries
See likely candidates for what is causing problems with their T-SQL and execution plans.
Kill them from in app with a click.
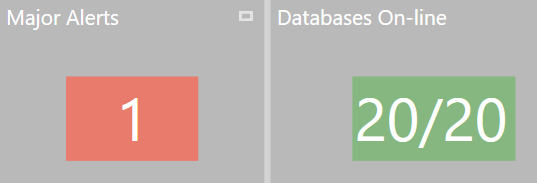
Reduce Your Workload
Minor alerts will warn you before before issues become critical enabling you to pre-emptively fix issues.