SQL Server and Azure SQL
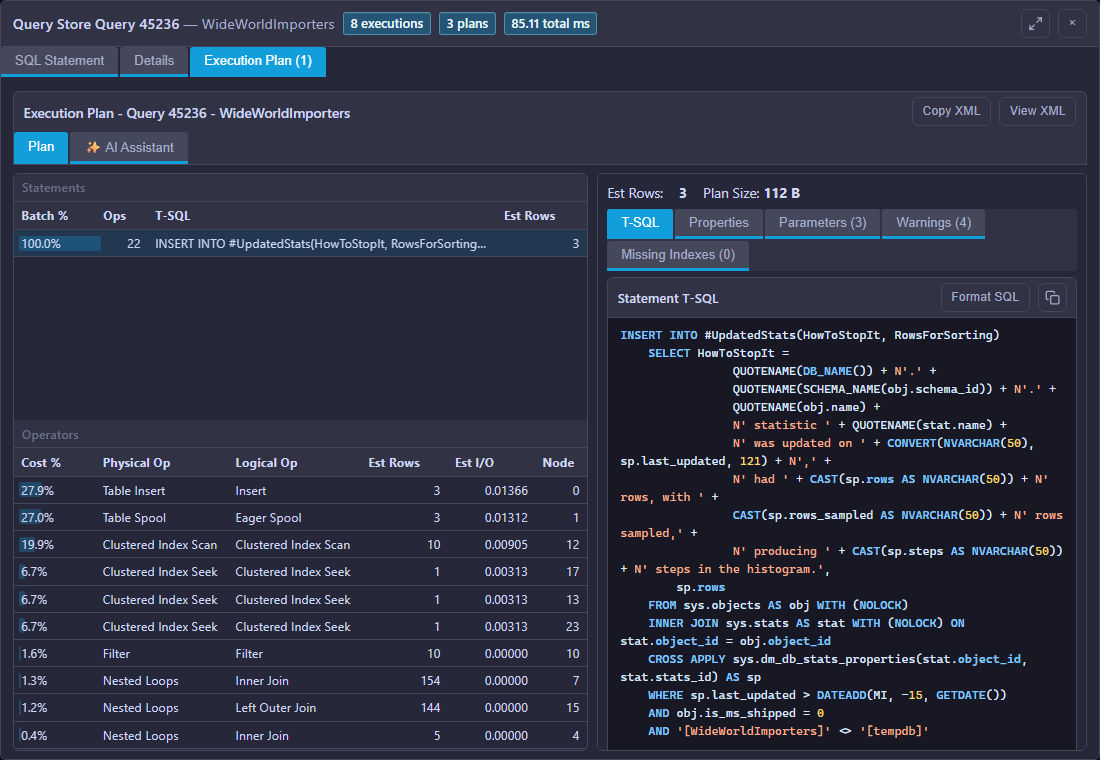
combine live requests, cached SQL, Query Store and graphical execution plans.
The slowest query is not always the query consuming the most total resources. Mini DBA brings duration, executions, CPU, reads, writes, waits and execution plans together so teams can prioritise the statements that matter to users and capacity.
A useful tuning decision accounts for frequency, concurrency, plan shape, data volume and the server constraint at the time. Live and historical query monitoring provides that context and makes it possible to distinguish a one-off expensive request from a small inefficiency repeated thousands of times.
Mini DBA keeps the workflow consistent while exposing the platform-specific evidence needed for a reliable diagnosis.
combine live requests, cached SQL, Query Store and graphical execution plans.
examine active statements, collected query statistics and EXPLAIN plan evidence.
relate current workload and statement statistics to EXPLAIN output and InnoDB pressure.
connect SQL activity, execution plans, waits and resource consumption.
SQL Server PostgreSQL MySQL and MariaDB Oracle Azure SQL
Explore cross-platform database monitoring across the complete mixed estate
Start from evidence, narrow the scope and verify the result instead of applying a generic tuning checklist.
Start from a slow application period, performance alert or query ranking for the affected server.
Compare duration, executions and resource use to select the statements with meaningful impact.
Inspect waits, plan operators, warnings, estimates and relevant indexes before proposing a change.
Measure the same query and server signals after deployment to confirm the improvement and detect regressions.
The Mini DBA AI Assistant can start with a focused question and optionally include the selected metrics, alerts, sessions, query, plan or event. Use it to explain evidence and propose checks; a DBA remains responsible for verification and production changes.
The Database MCP Server lets an approved AI client move from an estate-wide question to affected servers and historical detail, including multi-client workflows used by support and MSP teams.
Use the cross-platform execution-plan workflow.
Review active and historical SQL Server query evidence.
Inspect PostgreSQL statement activity and performance.
Analyse Oracle SQL workload and execution detail.
Use a problem-led workflow across SQL Server, PostgreSQL, MySQL, MariaDB, Oracle and Azure SQL.
Find the lead blocker and understand every waiting session.
Investigate blocking →Preserve participants, statements and resources after the event.
Analyse deadlocks →Prioritise expensive workload and inspect execution plans.
Reconstruct incidents after the live symptoms have gone.
Explore history →Install Mini DBA on Windows, a suitable Linux VM or a supported container platform, connect an Engine and start collecting the evidence behind performance incidents.