SQL Server and Azure SQL
connect requests, lock waits, open transactions and execution plans.
Blocking turns a small transaction problem into slow applications, timeouts and queues of waiting work. Mini DBA shows the sessions holding locks, the work waiting behind them and the wider performance context needed to choose a safe response.
A blocker is not automatically the session to terminate. It may be completing useful work, waiting on another resource or sitting inside an application transaction. Continuous monitoring and history let you identify the lead blocker, understand the statements involved and confirm whether the pattern is isolated or recurring.
Mini DBA keeps the workflow consistent while exposing the platform-specific evidence needed for a reliable diagnosis.
connect requests, lock waits, open transactions and execution plans.
expose blocked and blocking backends, lock modes and idle-in-transaction risk.
investigate InnoDB lock waits, long transactions and connection pressure.
relate blocked sessions to blockers, wait events, SQL and transaction state.
SQL Server PostgreSQL MySQL and MariaDB Oracle Azure SQL
Explore cross-platform database monitoring across the complete mixed estate
Start from evidence, narrow the scope and verify the result instead of applying a generic tuning checklist.
Start with the application symptom, active alert or server showing an unusual session queue.
Open activity and lock detail to locate the head blocker and inspect all participating statements.
Compare waits, resource graphs and recent history to distinguish lock contention from a wider bottleneck.
Correct the transaction or query pattern, then use history and alerts to confirm the problem does not return.
The Mini DBA AI Assistant can start with a focused question and optionally include the selected metrics, alerts, sessions, query, plan or event. Use it to explain evidence and propose checks; a DBA remains responsible for verification and production changes.
The Database MCP Server lets an approved AI client move from an estate-wide question to affected servers and historical detail, including multi-client workflows used by support and MSP teams.
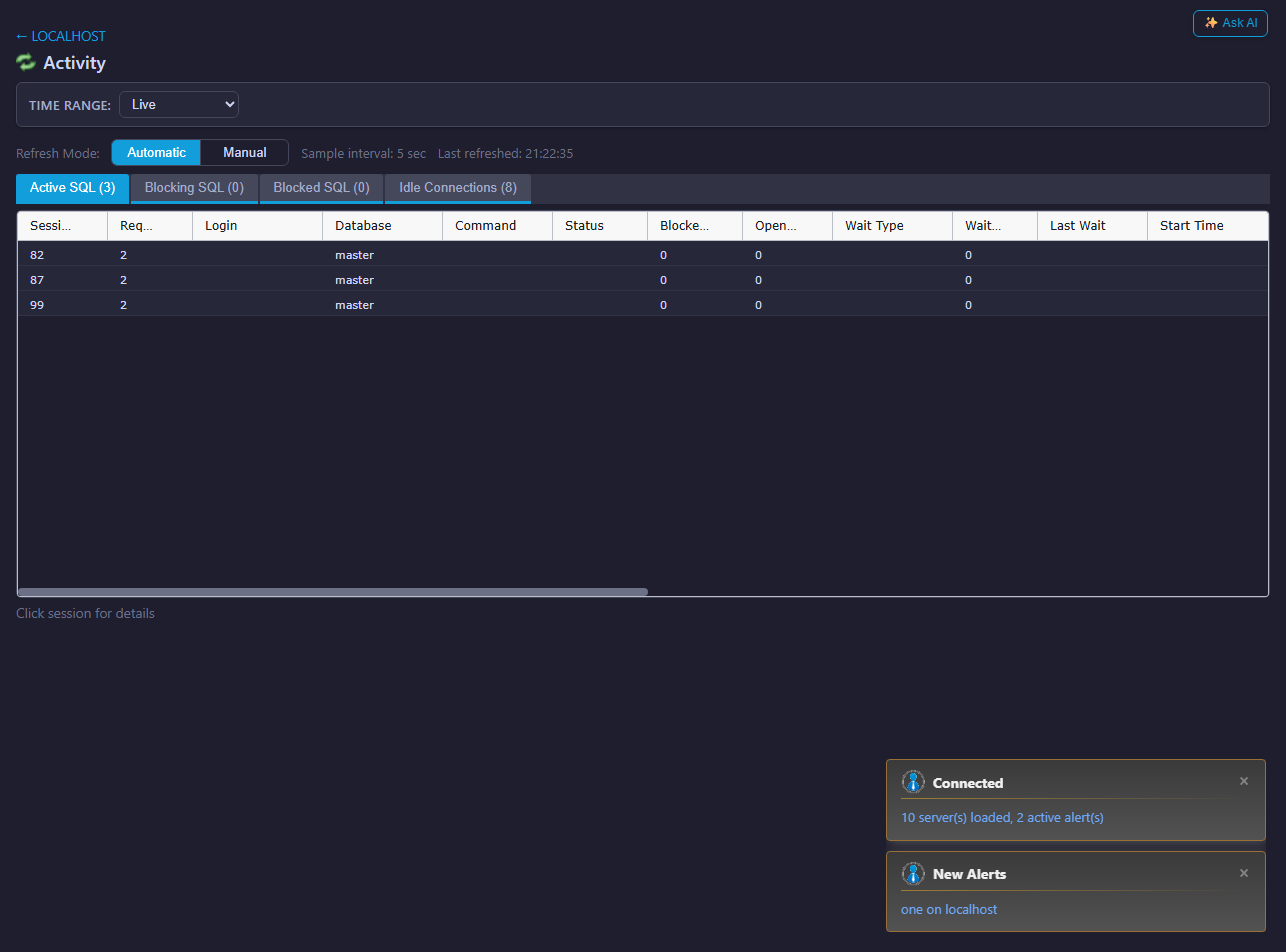
Sessions, requests and blocking detail in the Console.
Inspect PostgreSQL sessions, queries and transaction state.
Investigate current connections and executing statements.
Review Oracle sessions, SQL and waits.
Use a problem-led workflow across SQL Server, PostgreSQL, MySQL, MariaDB, Oracle and Azure SQL.
Find the lead blocker and understand every waiting session.
Preserve participants, statements and resources after the event.
Analyse deadlocks →Prioritise expensive workload and inspect execution plans.
Analyse queries →Reconstruct incidents after the live symptoms have gone.
Explore history →Install Mini DBA on Windows, a suitable Linux VM or a supported container platform, connect an Engine and start collecting the evidence behind performance incidents.