Azure database monitoring that explains Azure SQL pressure
A high DTU or vCore percentage tells you that Azure SQL is under pressure, but not which query, wait, session or database behaviour created it. Mini DBA connects Azure database monitoring signals with workload evidence so you can tune the cause before paying for more capacity.
Use one Azure SQL monitoring tool for individual databases, logical servers and elastic pools while retaining the query and metric history needed to explain intermittent performance and capacity events.
Problems you can solve faster
- Find queries behind DTU, vCore, data I/O or log pressure.
- Investigate blocking, deadlocks, waits and connection limits.
- See contention and capacity across elastic pools.
- Catch storage, service-tier and database health risks early.
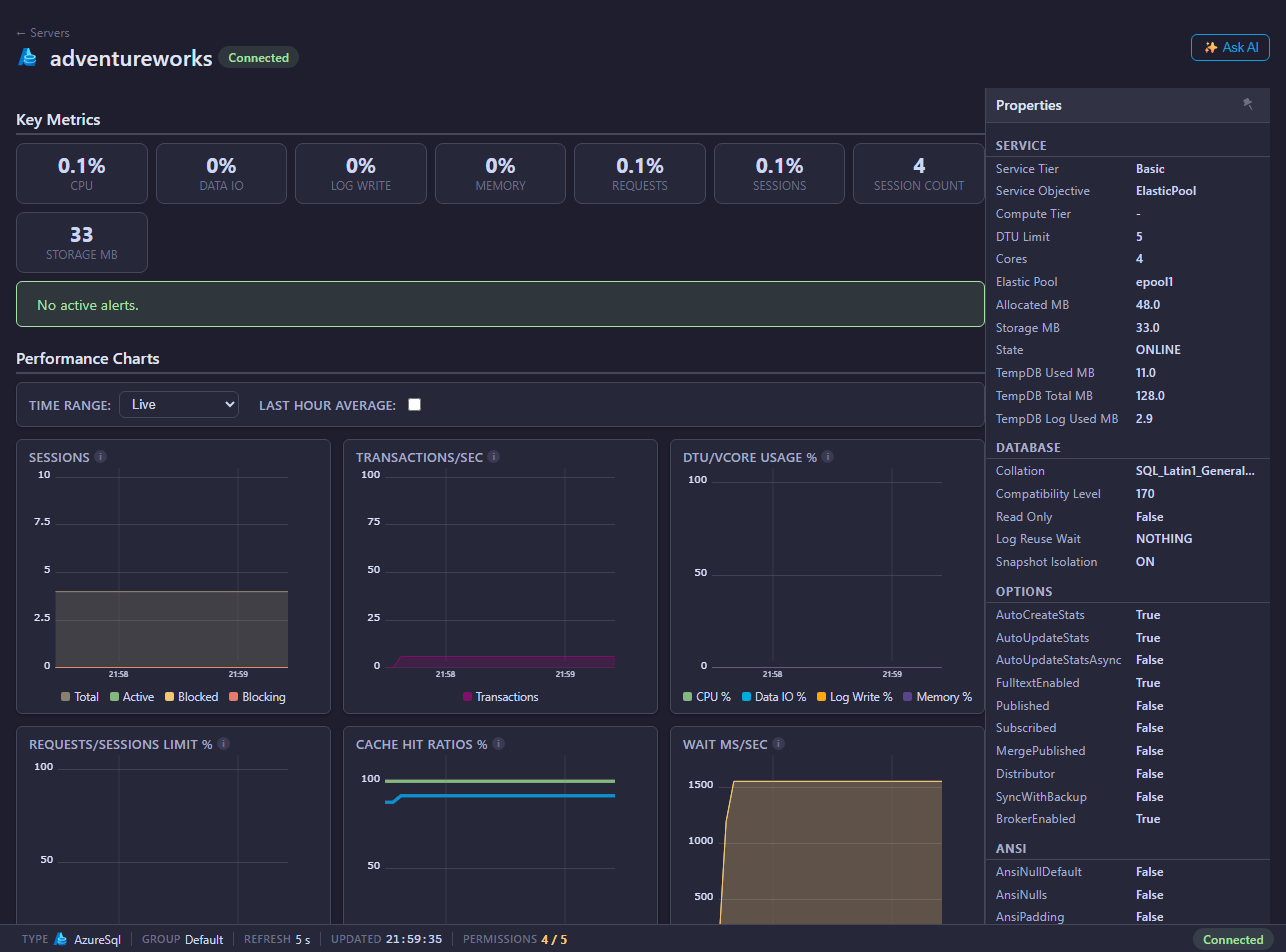


Azure SQL monitoring features
- DTU or vCore, CPU, data I/O, log and storage monitoring.
- Sessions, queries, waits, blocking, deadlocks and Query Store.
- Logical server, database and elastic-pool visibility.
- Indexes, files, memory, permissions and health checks.
- Profiler and performance-tuning evidence for difficult workloads.
History, alerts and AI-assisted analysis
- Metric and query history for transient cloud performance events.
- Configurable alerts and alert history for resource and availability risks.
- AI Assistant for guided diagnosis using Azure SQL context.
- Azure SQL MCP monitoring within the same multi-database investigation workflow.
- One Console for Azure SQL and on-premises database platforms.
Investigate Azure SQL performance instead of watching percentages
Start with service utilisation, then follow the affected database into the workload evidence that explains the change. Mini DBA keeps each diagnostic workflow linked to the same monitored Azure SQL environment.
Diagnose Azure database monitoring alerts by resource
A DTU percentage is driven by the highest of CPU, data I/O and log-write utilisation, so a high value does not by itself tell you which limit is responsible. Compare the component metrics over the same interval, then inspect the affected database's queries, waits and sessions. For vCore databases, use CPU, data I/O, log I/O, worker and storage signals together; a database can hit a service limit even when CPU is not the leading symptom.
When the resource signal changes, use Query Store or retained query history to find the statements whose duration, execution count or plan changed in the same window. Check whether the issue affects one database or several databases in an elastic pool before resizing shared capacity. A short-lived spike, a steady rise and a sudden plan regression call for different responses.
Monitor every database platform from one Console
SQL Server PostgreSQL MySQL and MariaDB Oracle
Explore cross-platform database monitoring across the complete mixed estate
Investigate the database problem, not just the platform
Use a problem-led workflow across SQL Server, PostgreSQL, MySQL, MariaDB, Oracle and Azure SQL.
Blocking and lock contention
Find the lead blocker and understand every waiting session.
Investigate blocking →Deadlock analysis
Preserve participants, statements and resources after the event.
Analyse deadlocks →Query performance
Prioritise expensive workload and inspect execution plans.
Analyse queries →Performance history
Reconstruct incidents after the live symptoms have gone.
Explore history →Install Mini DBA on Windows, a suitable Linux VM or a supported container platform, connect an Engine and start collecting the evidence behind performance incidents.