Legacy Mini DBA Desktop 4.3
Legacy product: this page describes Mini DBA Desktop 4.3 for existing users. New installations should use the current Mini DBA browser Console and monitoring Engine.
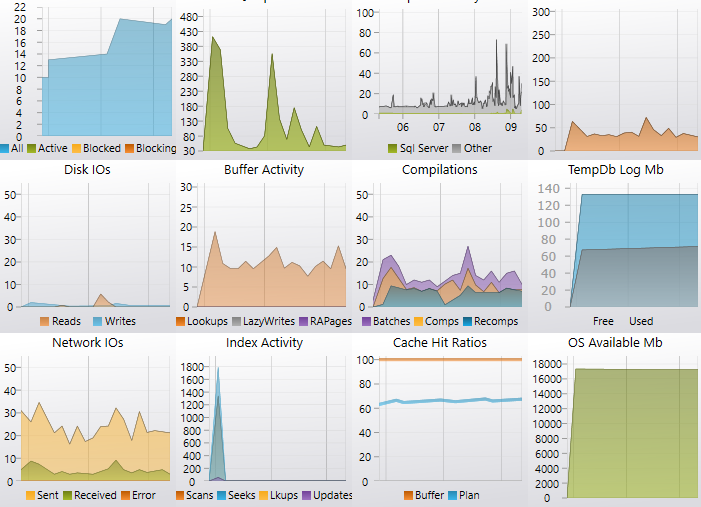
Stand alone Application
- Totally self contained monitoring and data logging.
- No need for miniDBA Server or backend log storage databases.
- Windows XP and later, Server 2003 and later
- Designed for monitoring and performance tuning of SQL Server 2008 -> 2017
- Free for single direct SQL Server connection then from $99 USD onwards
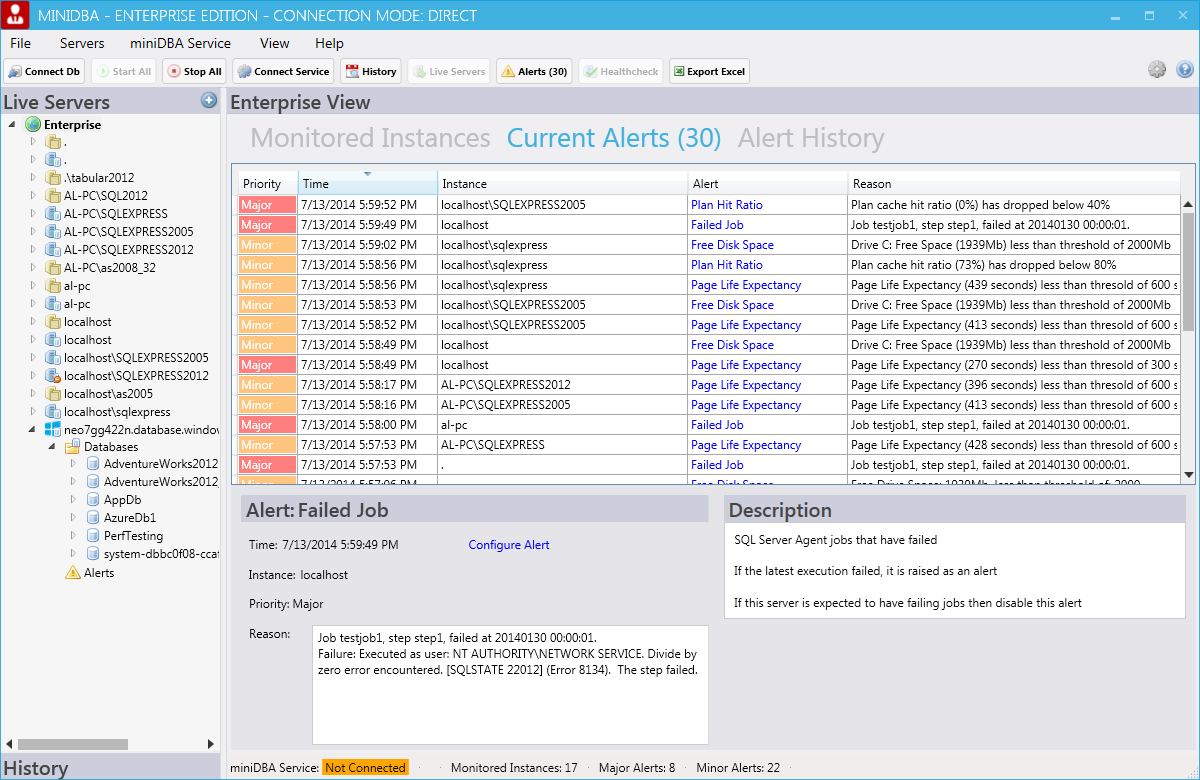
Optional use of miniDBA Server
- Monitoring is ad-hoc as it stops when miniDBA desktop is closed where as server keeps monitoring 24*7.
- Instead of connecting directly to the database miniDBA desktop can connect to miniDBA server
- Teams may choose to have all clients connect to a single miniDBA Server instead of direct connections to the database servers to reduce server load.
- Ideal for production and larger team environments.
- Resource intensive features can be disabled for miniDBA clients.
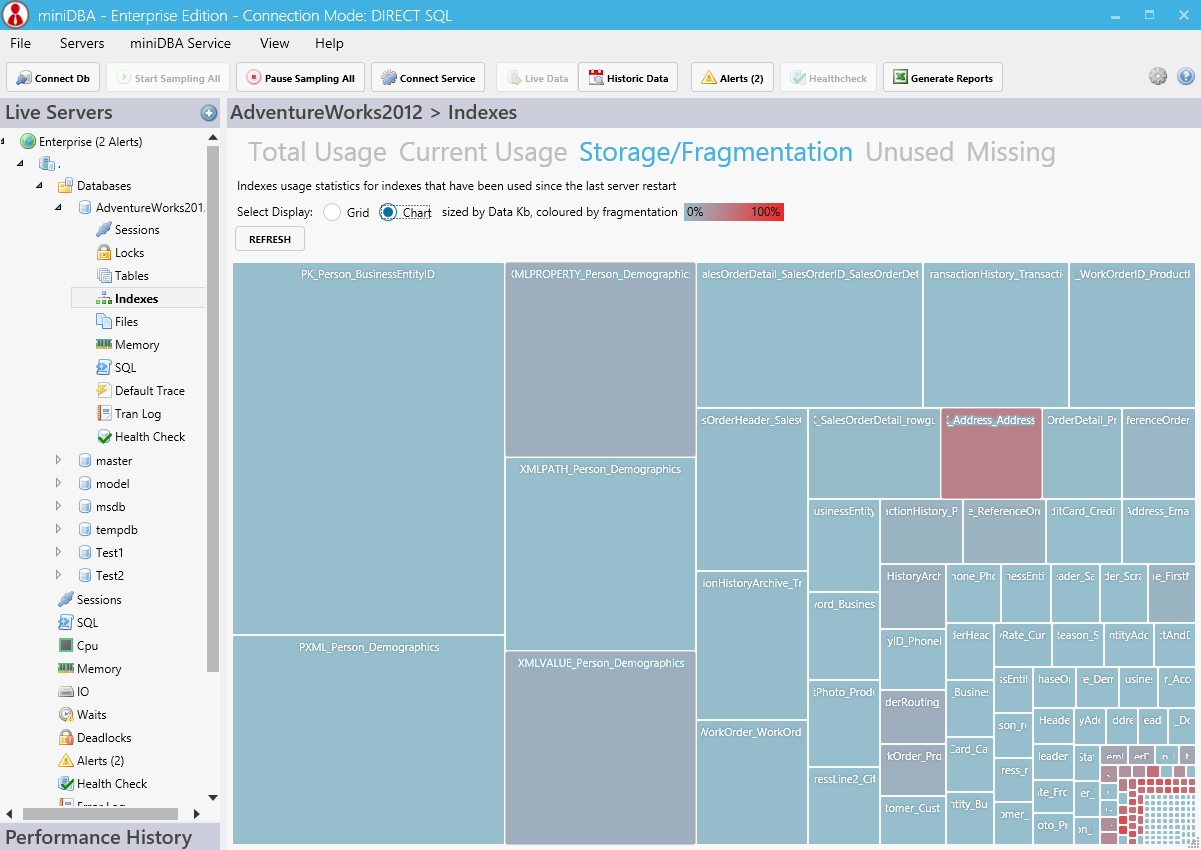
Performance tune T-SQL
- Identify worst performing statements & causes (CPU, IO, memory, locks)
- Index analysis - Live index usage, Fragmentation with the index heatmap & Unused\Recommended indexes
- Wait statistics - See live view of current & total waits & associated wait type descriptions
- Query plan analysis - worst performing operators are identified for you without having to search a graphical execution plan for them
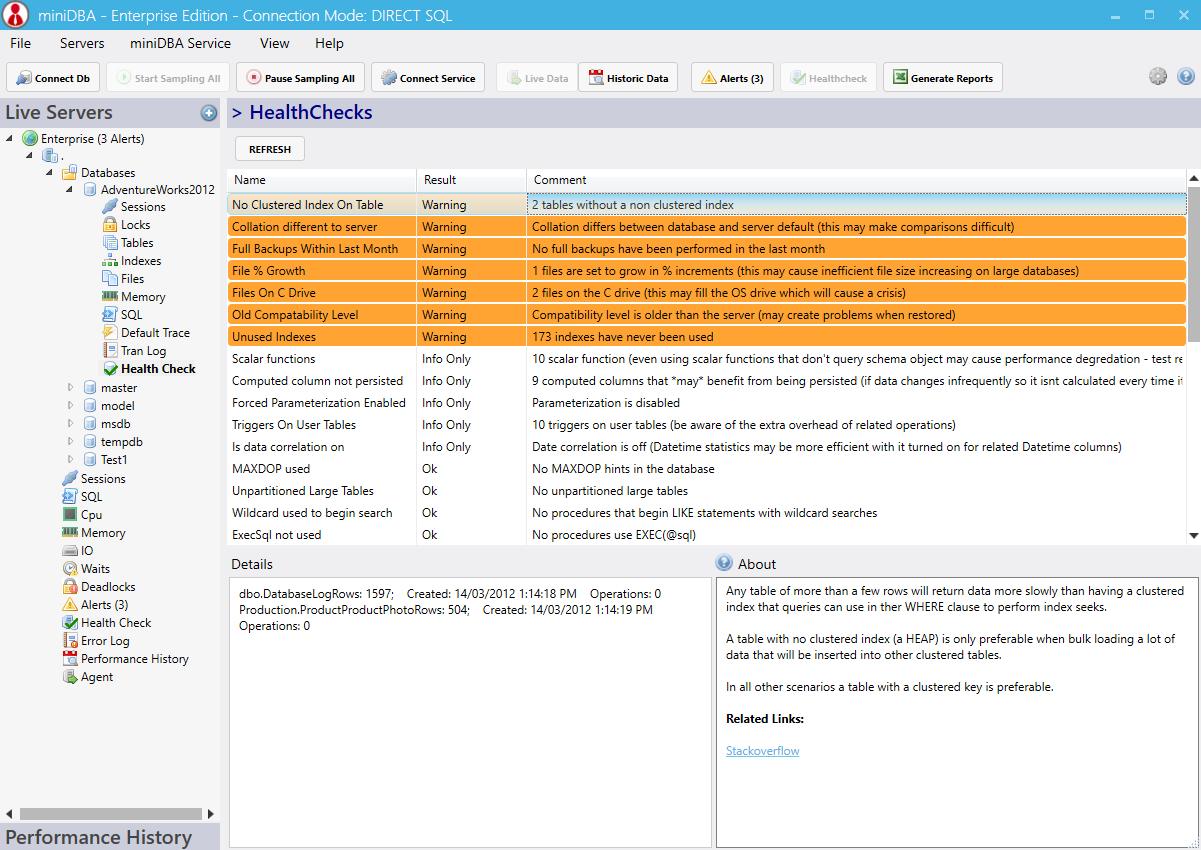
Health Checks
- Run over 50 diagnostic checks at server & database level with 1 click.
- Be warned of configuration, design or performance problems; key information for performance tuning.
- All T-SQL is analysed for coding practises that may negatively affect performance.
- 'About' window gives detailed explanation of healthcheck with links to best practise articles and other relevant articles.
- Create your own custom healthchecks by providing your T-SQL
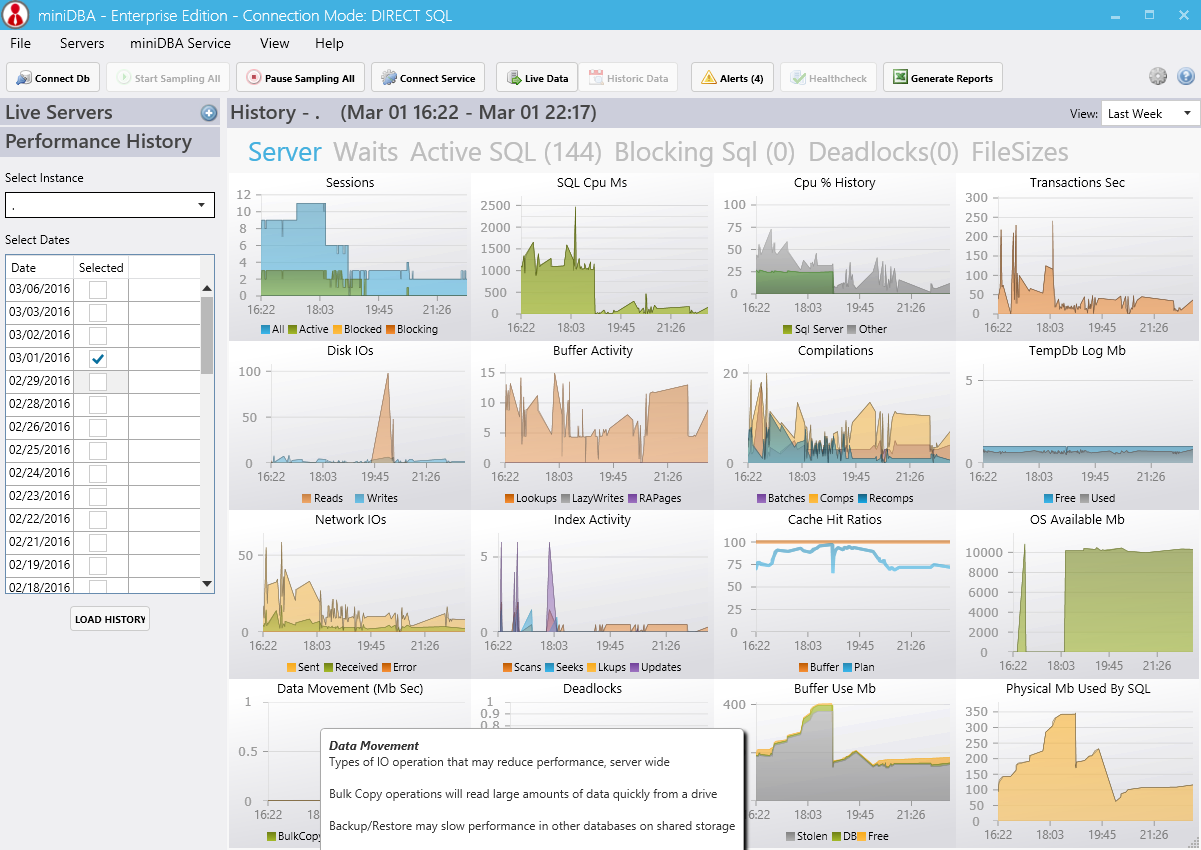
Analyse History
- Sampled data is stored and can be viewed in the History Viewer: performancecounters, waits, deadlocks & Sql are all available for performance analysis
- Review historic saved data to plan scaling & increase the lifespan of your hardware
- Monitor data is written to an internal database - no need to setup & license a logging database
More...
- Custom and pre-formatted Excel & PDF reports can be created and emailed from within the application: performance counters, waits & blocking statements are all available for performance analysis
- SQL Server Agent Dashboard - use a calendar view of previous job execution to intelligent schedule jobs at the best times
- Alert workflow - uncleared alerts can be commented on allowing for assignment to team members
- Point in time performance data is saved with every alert meaning you can see the server's state when the alert was raised
- Deadlocks are saved and can be fully reviewed using the graph in the xml viewer
- Live metrics for every storage device that is used by SQL server
- See all Windows processes on each monitored server, identify anything fighting for processor time
- Descriptive tooltips for all graphs and links to appropriate msdn articles for properties to help users learn
- Advanced memory dashboard lets you see how buffer, plan cache and operating system are using RAM
- See the last hours average useage for certain metrics, to identify large changes in server behaviour