Sql Server Monitor
Providing a solid monitoring solution is an essential part of having a high performance, reliable and scalable SQL Server\Azure Database estate. Many scripts and tools are required to proactively detect problems that have not occurred yet as well as alert your team to problems that are occurring. Read about them here and here.
Mini DBA aims to provide 1 tool that centralizes what is normally provided by T-SQL scripts, Powershell, WMI, Performance Monitor, Windows Task Manager and Email Configuration. Monitor SQL Server and Azure SQL Database side by side..
Peace of Mind
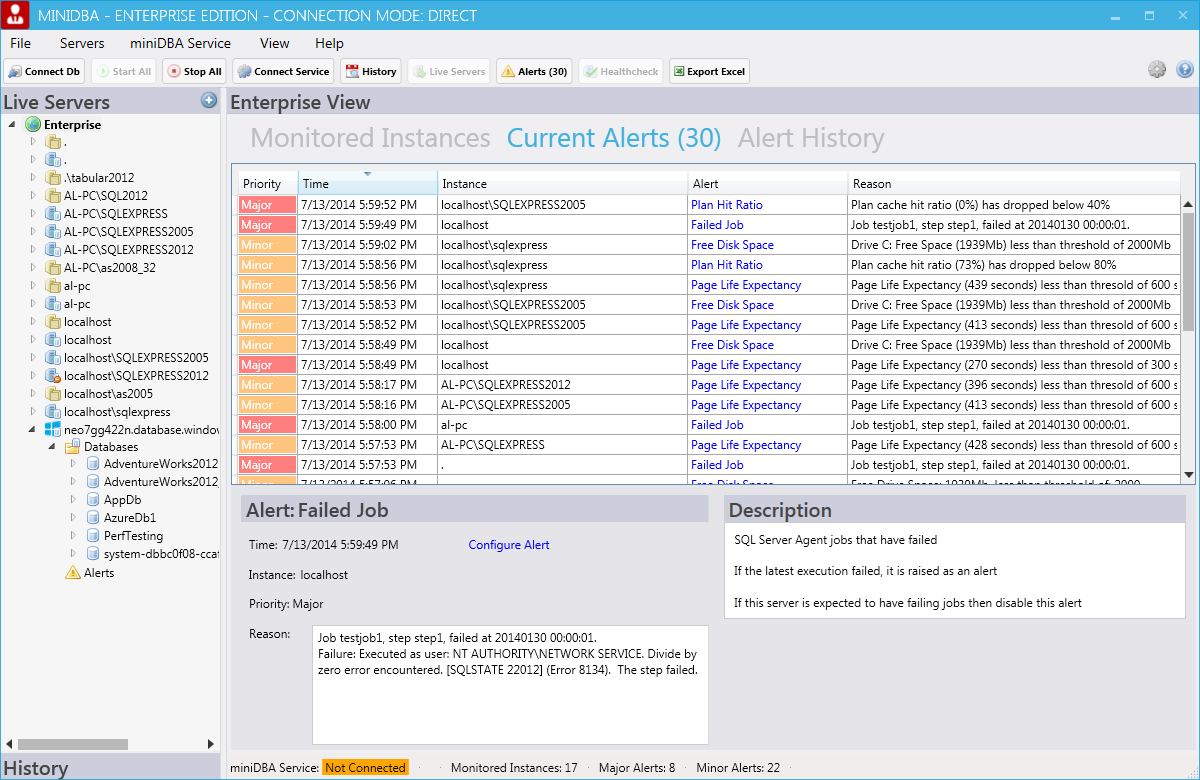
MiniDBA performs 24*7 SQL Server monitoring and sends alerts (Email, Slack, PagerDuty) when servers are about to run into problems. You decide on what is high and low priority and how far in advance you want to be warned of any performance issues.
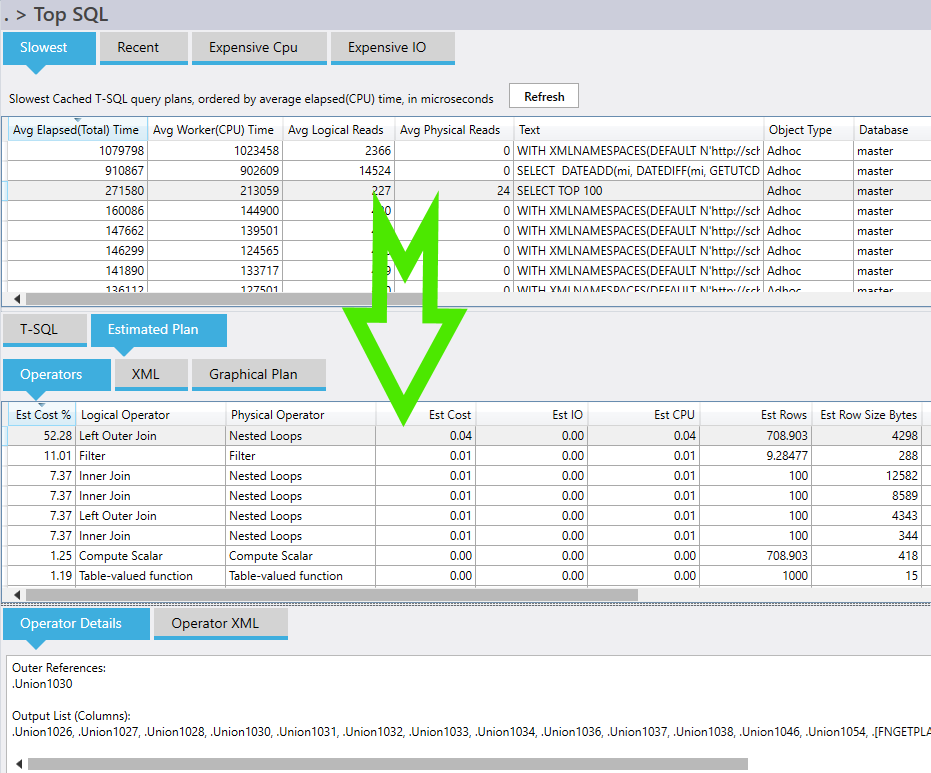
Intelligent Analysis: All alerts raised show you what queries were running at the time of the alert and also their execution plan if they were non trivial. Combine that with all performance metrics gives you a clear picture of why your SQL Server is going slow and what is causing it.
Constant monitoring of wait statistics adds clarity to the picture of what is happening in your servers. See not just all wait stats since the server started but stats that are happening now. miniDBA has descriptions for known wait types that will help you understand what is happening when things slow down.
Gain Performance
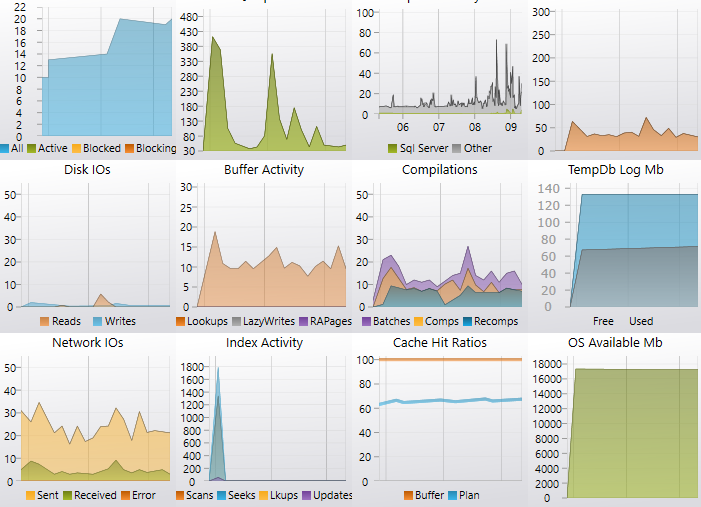
Instantly see where your SQL Servers performance problems are as soon as you register them with miniDBA. After it starts monitoring you can see the internals of your databases and where their pain points are. Identify resource usage trends over time and see not only how much cpu and memory are being used by by who and why. This is next level monitoring putting the information in your hands in a way that frees your time.
Know if any drives have IO contention or your transaction log is about to be filled up.
Take the advice miniDBA gives you in healthchecks and tune your SQL Server to maximize its speed and lifetime. Through T-SQL code recommendations you can gain more performance without spending any budget upgrading your hardware.
Root Cause Analysis
miniDBA doesn't just tell you when monitored metrics cross thresholds - it also tells you all about the SQL Servers state at that exact instance. Drill down from either live metrics or any historic minute to see full server state. All metrics have explanations in case you are not sure what they mean to help you learn about SQL Server internals as you go.
When viewing historic points in time miniDBA lets you just between correlated metrics, queries, wait statistics, individual file and drive IO performance and more. Use the connected graphs to zoom all of them in on the same time period.
Drill down into sessions and requests to see resource usage, locks, waits stats and even execution plans and their live progress.
Features
- Simple to connect directly to any SQL or Azure Server
- 40+ Health checks and 50+ Alerts for server and database
- Alerts configurable with different thresholds for different priorities
- A central display of all alerts across all enterprise servers lets you see an instant snapshot of all issues in your enterprise
- In App, Email, Event Log, Slack and PagerDuty can be used to raise alerts
- Always On dashboard and replication alerts
- SQL Server Agent Jobs status viewed as calendar
- Custom SQL Query alerts - write any alert you want
- Index maintenance - create index defragmentation jobs on a schedule
- Report in Excel or PDF
- SQL Server monitoring on any web browser or mobile device via miniDBA Web Monitor
- Web Monitor has no limits on the number of users that can connect to it - licensing is done within miniDBA Server, per connected SQL Server


