Browser Console
Use the same current interface for estate health, database-specific dashboards, queries, plans, alerts and retained history.
Mini DBA gives developers a browser-based path from a slow application request to the database sessions, queries, waits and execution plans behind it, using the same current workflow as the rest of the team.
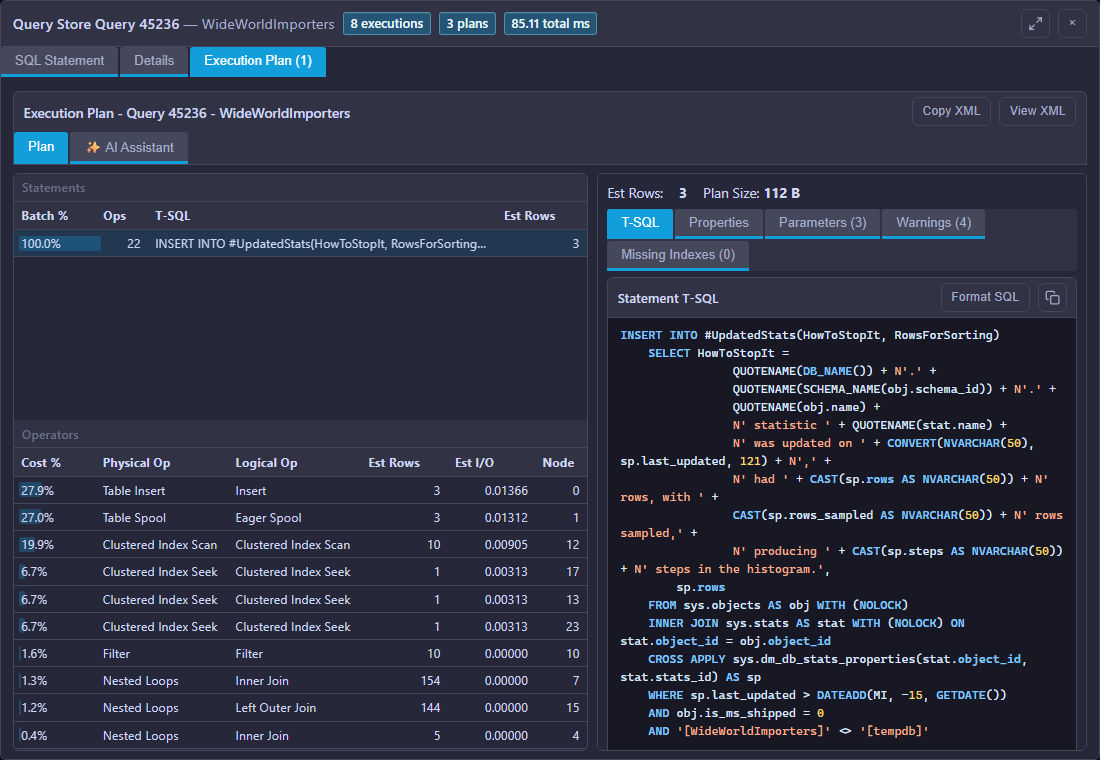
Use the same current interface for estate health, database-specific dashboards, queries, plans, alerts and retained history.
Ask focused questions with optional metrics, sessions, alerts, deadlocks and execution-plan context from the page being investigated.
Let approved MCP-compatible AI tools ask broader questions across servers, history and managed customer environments.
Install Mini DBA on Windows, a suitable Linux virtual machine, or a supported container platform. The Engine collects continuously while users connect through the browser Console. Optional additional Engines support advanced multi-site or network-separated estates.
SQL Server PostgreSQL MySQL and MariaDB Oracle Azure SQL
Explore cross-platform database monitoring across the complete mixed estate
Use a problem-led workflow across SQL Server, PostgreSQL, MySQL, MariaDB, Oracle and Azure SQL.
Find the lead blocker and understand every waiting session.
Investigate blocking →Preserve participants, statements and resources after the event.
Analyse deadlocks →Prioritise expensive workload and inspect execution plans.
Analyse queries →Reconstruct incidents after the live symptoms have gone.
Explore history →Install Mini DBA on Windows, a suitable Linux VM or a supported container platform, connect an Engine and start collecting the evidence behind performance incidents.